47
47peptides
spectra
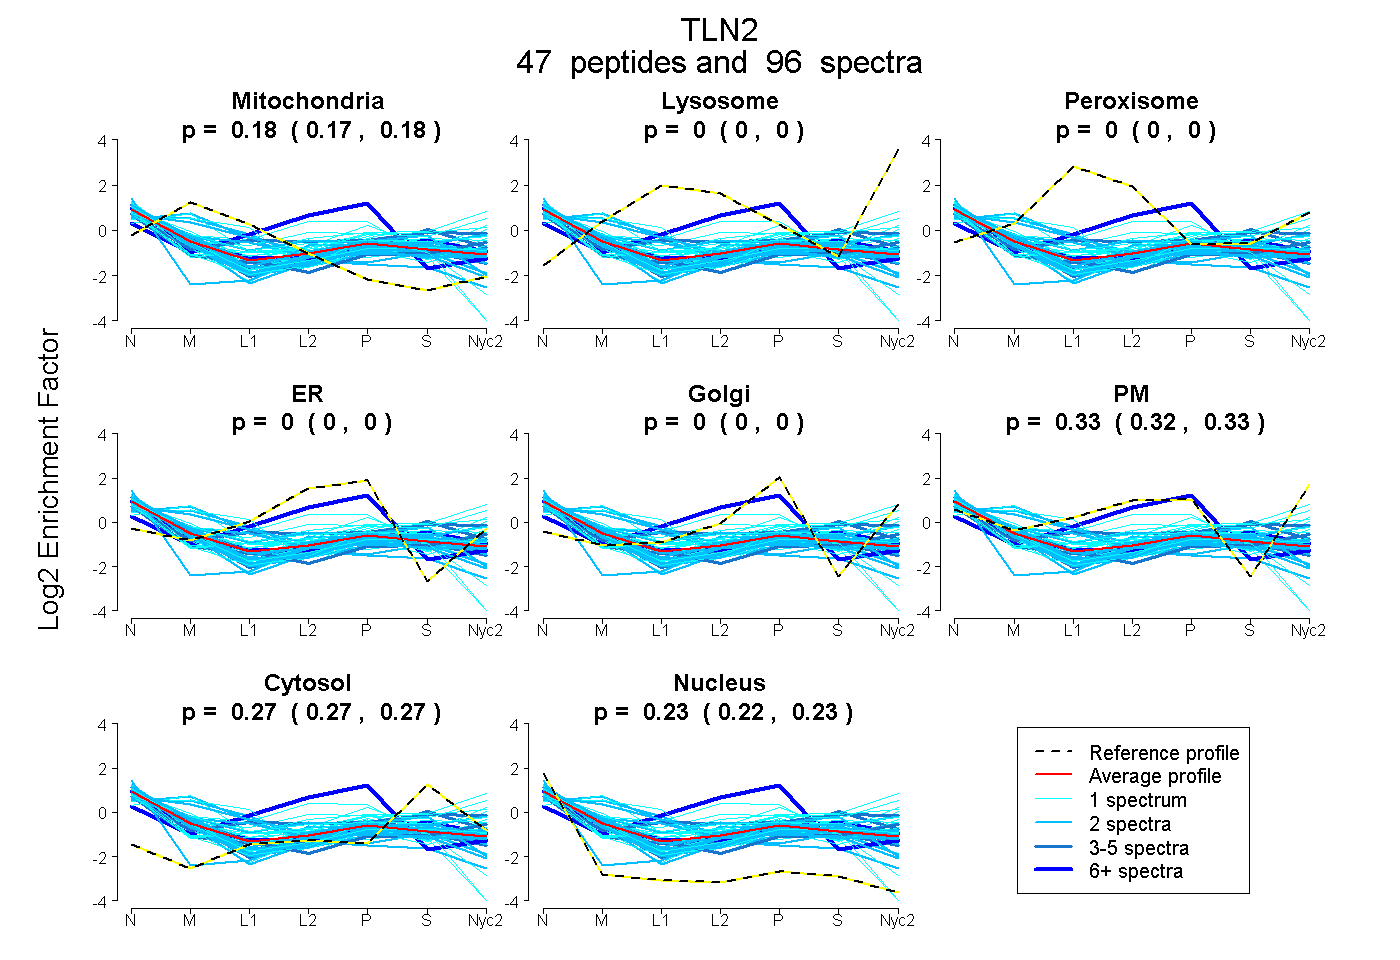
0.175 | 0.182
0.000 | 0.000
0.000 | 0.000
0.000 | 0.000
0.000 | 0.000
0.322 | 0.328
0.265 | 0.271
0.225 | 0.230
6peptides
spectra
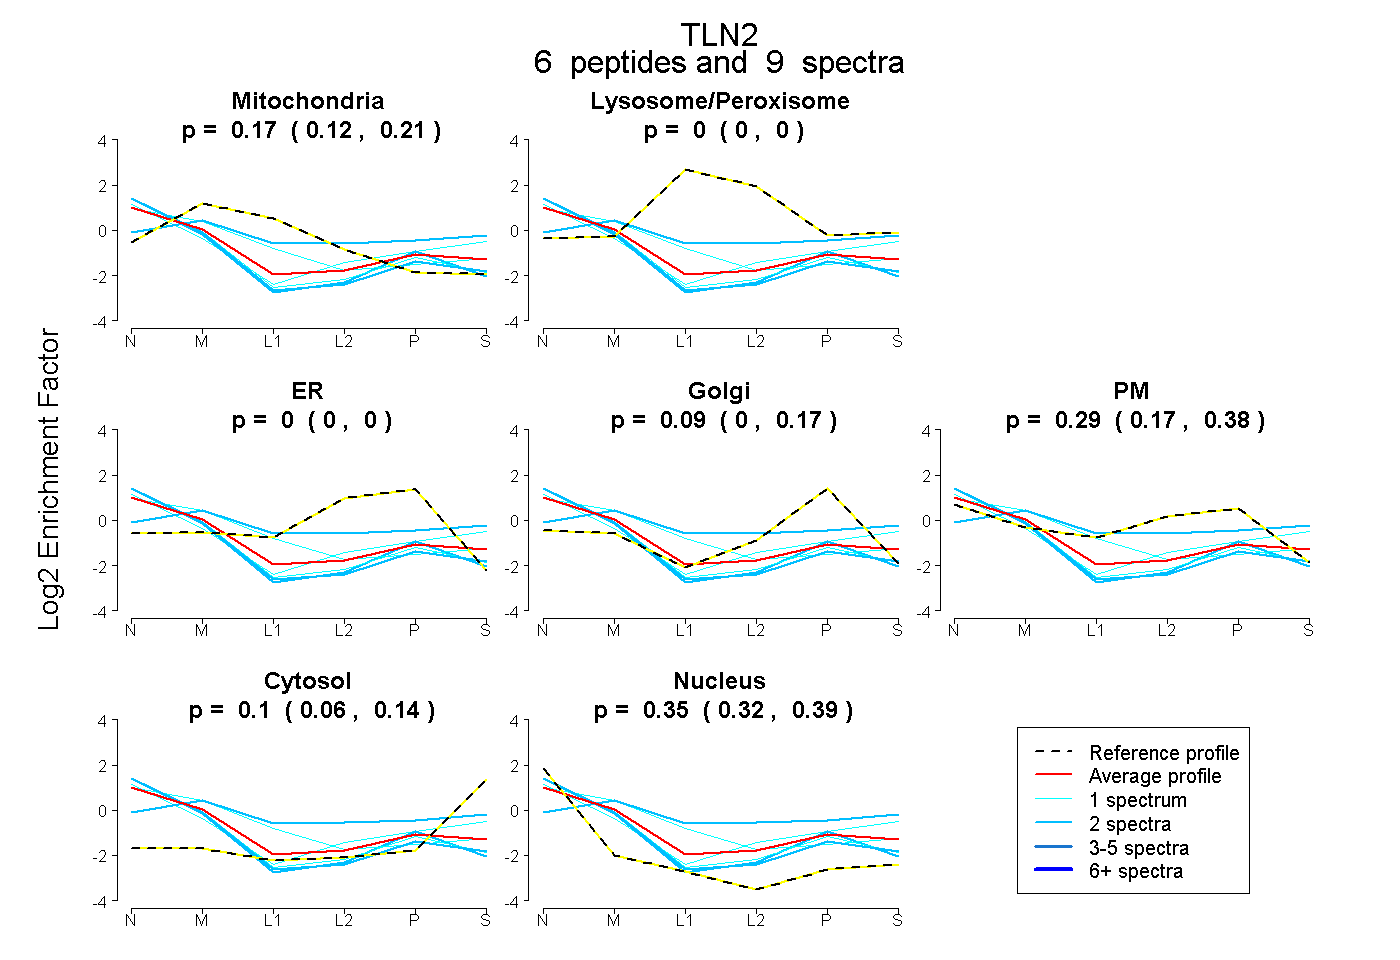
0.117 | 0.213
0.000 | 0.000
0.000 | 0.000
0.000 | 0.168
0.172 | 0.383
0.057 | 0.141
0.319 | 0.389