 5
5peptides
spectra
0.768 | 0.881
0.000 | 0.042
0.013 | 0.139
0.000 | 0.000
0.000 | 0.000
0.000 | 0.074
0.000 | 0.037
0.017 | 0.073
| Plot | Mito | Lyso | Perox | ER | Golgi | PM | Cytosol | Nucleus | |||||
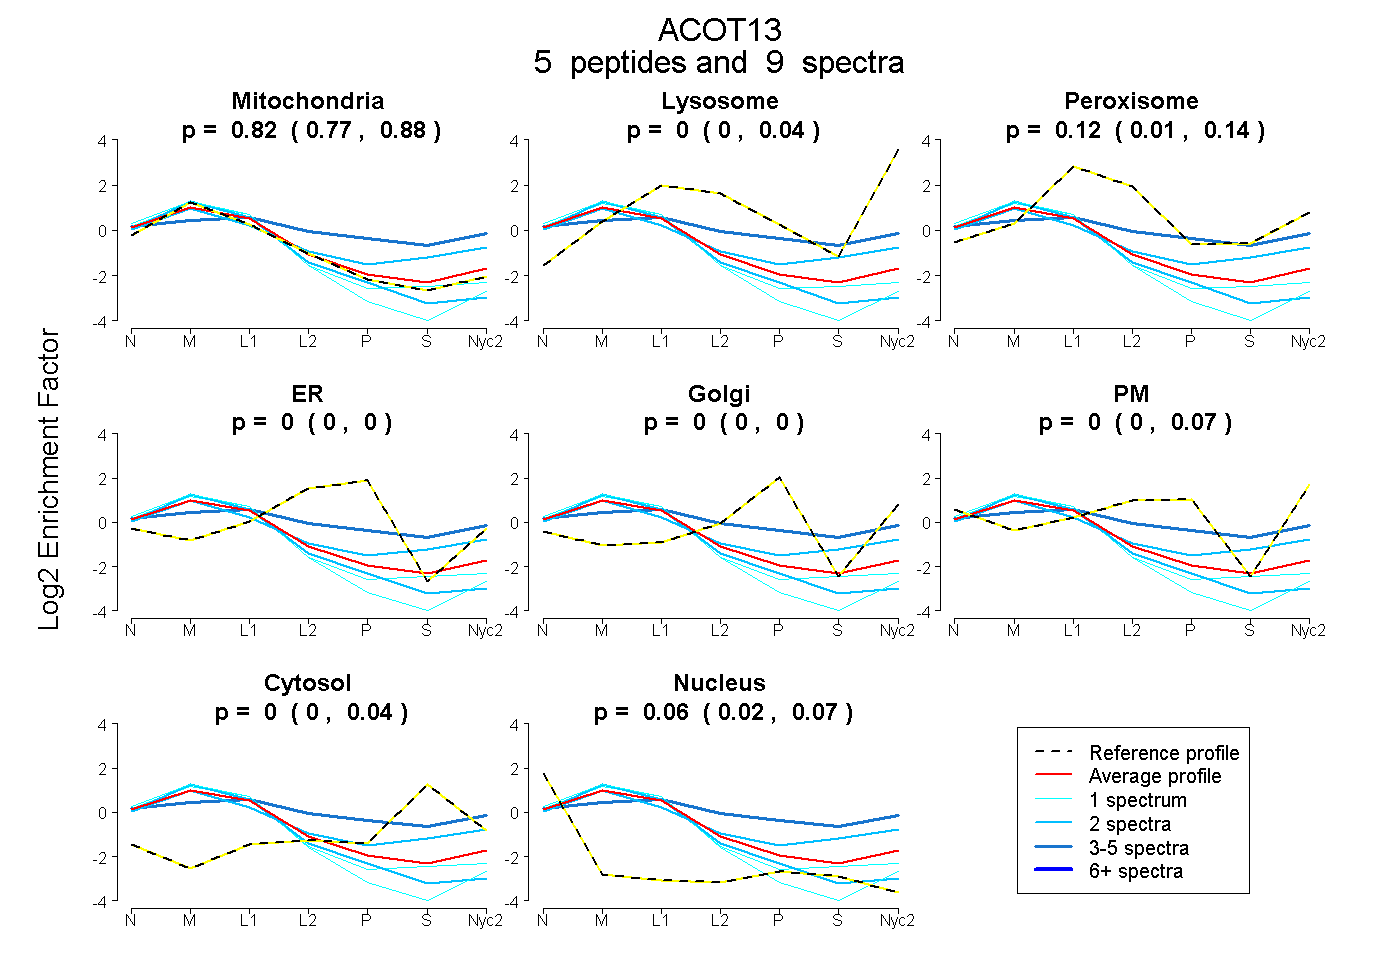
| Expt A |
5 peptides |
9 spectra |
|
0.820 0.768 | 0.881 |
0.000 0.000 | 0.042 |
0.118 0.013 | 0.139 |
0.000 0.000 | 0.000 |
0.000 0.000 | 0.000 |
0.001 0.000 | 0.074 |
0.000 0.000 | 0.037 |
0.061 0.017 | 0.073 |
| 1 spectrum, VEEQHTNK | 0.936 | 0.000 | 0.000 | 0.000 | 0.000 | 0.000 | 0.000 | 0.064 | ||
| 2 spectra, LICEMK | 0.951 | 0.000 | 0.000 | 0.000 | 0.000 | 0.000 | 0.000 | 0.049 | ||
| 1 spectrum, IGEEIVITAHILK | 0.964 | 0.000 | 0.000 | 0.000 | 0.000 | 0.000 | 0.000 | 0.036 | ||
| 2 spectra, VPGFDR | 0.646 | 0.096 | 0.048 | 0.000 | 0.000 | 0.049 | 0.160 | 0.000 | ||
| 3 spectra, GAPGVSIDMNITYMSPAK | 0.277 | 0.000 | 0.271 | 0.000 | 0.000 | 0.260 | 0.192 | 0.000 |
| Plot | Mito | Lyso or Perox | ER | Golgi | PM | Cytosol | Nucleus | ||||||
| Expt B |
4 peptides |
4 spectra |
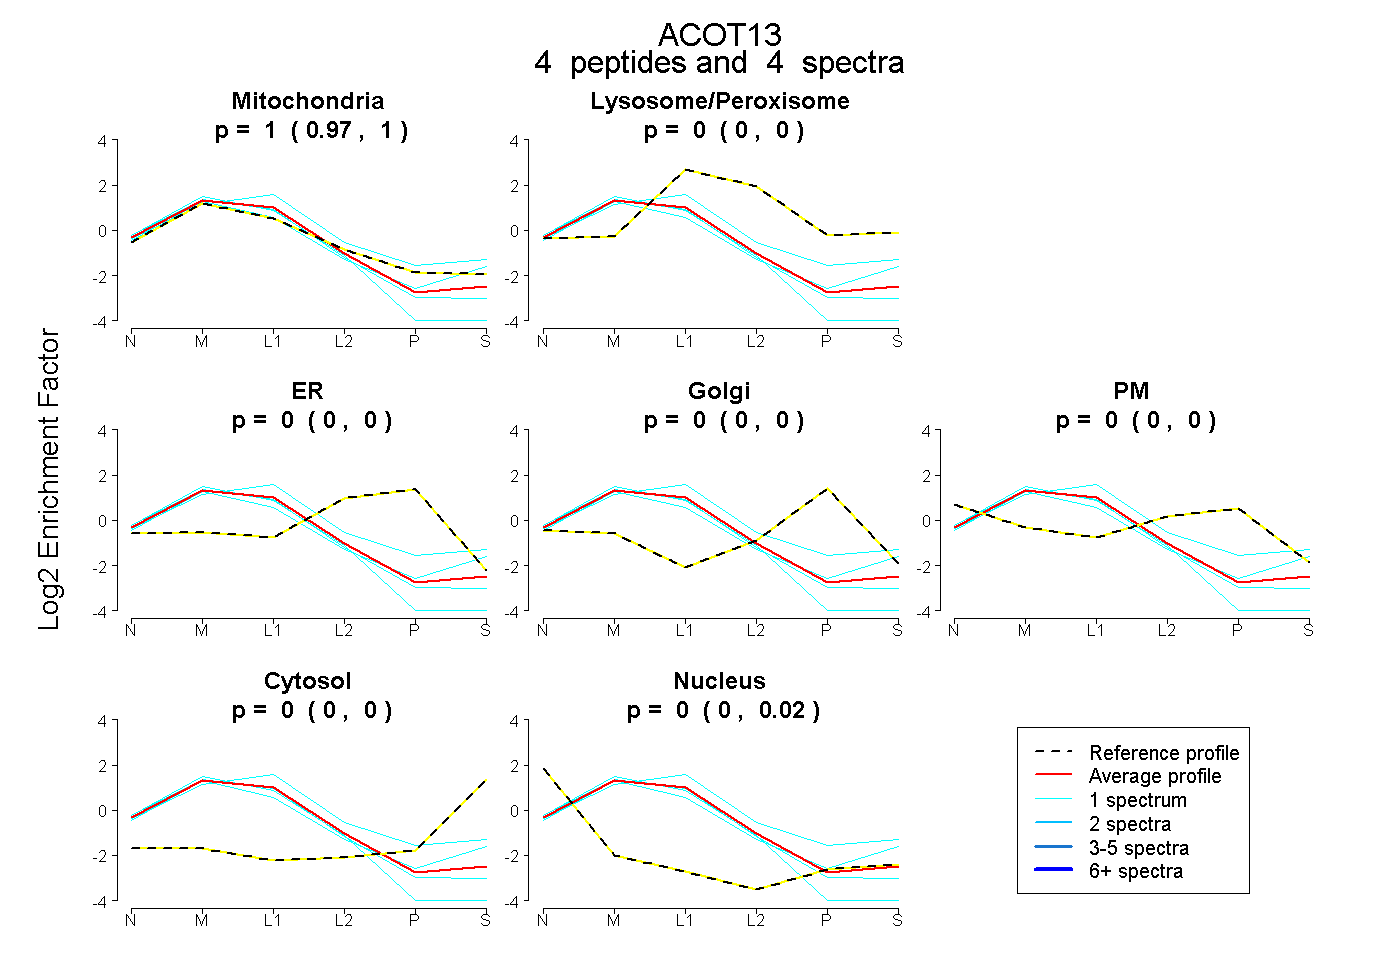 |
0.999 0.971 | 1.000 |
0.000 0.000 | 0.000 |
0.000 0.000 | 0.000 |
0.000 0.000 | 0.000 |
0.000 0.000 | 0.000 |
0.000 0.000 | 0.000 |
0.001 0.000 | 0.024 |
|||
| Plot | Lyso | Other | |||||||||||
| Expt C |
7 peptides |
46 spectra |
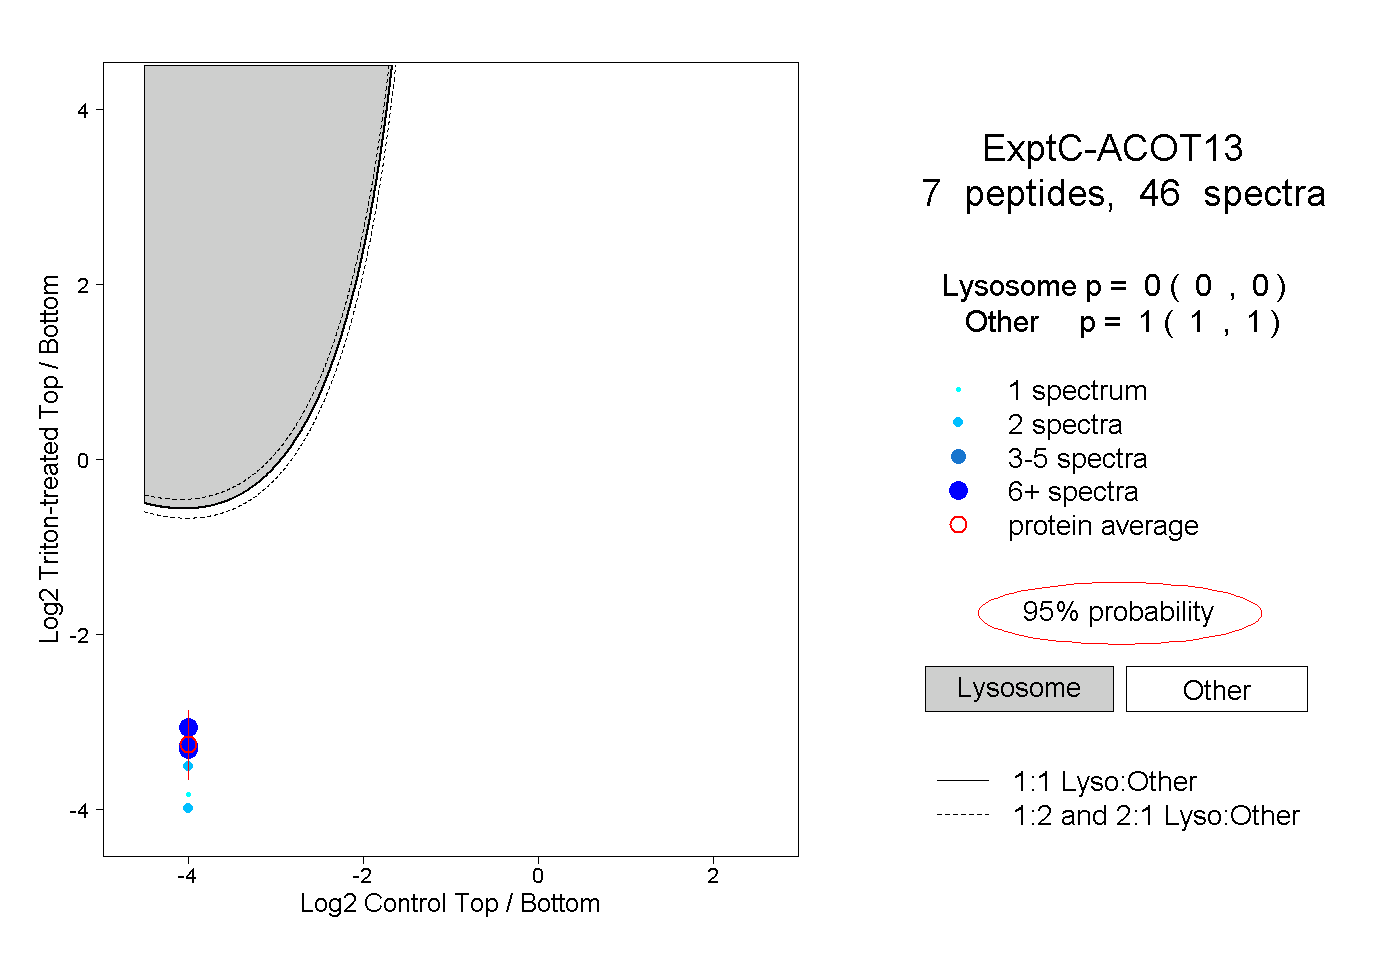 |
0.000 0.000 | 0.000 |
1.000 1.000 | 1.000 |
||||||||
| Plot | Lyso | Other | |||||||||||
| Expt D |
4 peptides |
7 spectra |
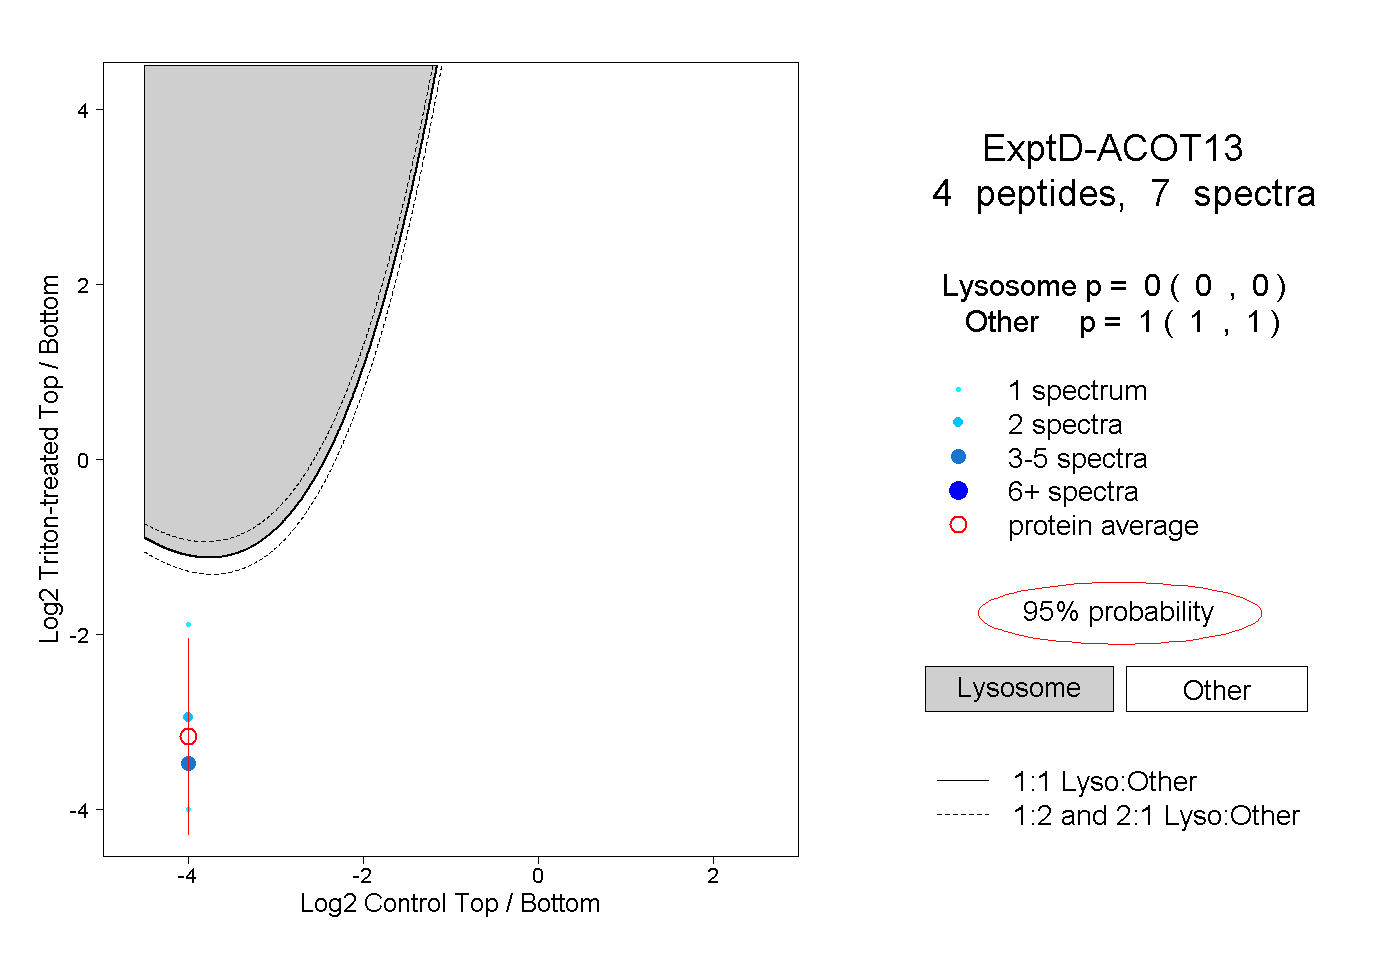 |
0.000 0.000 | 0.000 |
1.000 1.000 | 1.000 |