 5
5peptides
spectra
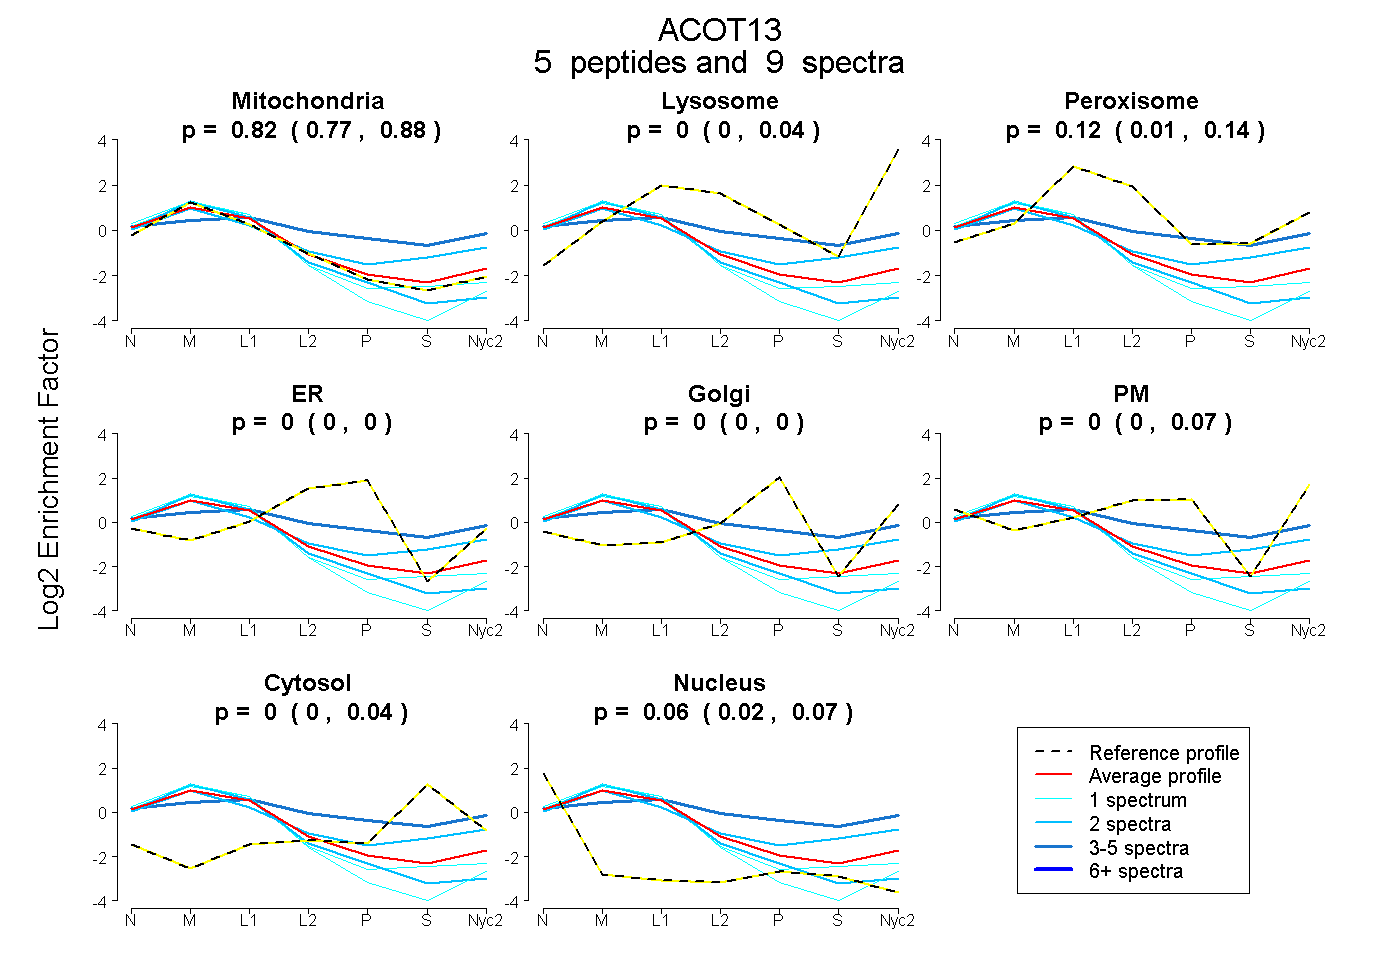
0.768 | 0.881
0.000 | 0.042
0.013 | 0.139
0.000 | 0.000
0.000 | 0.000
0.000 | 0.074
0.000 | 0.037
0.017 | 0.073
4peptides
spectra
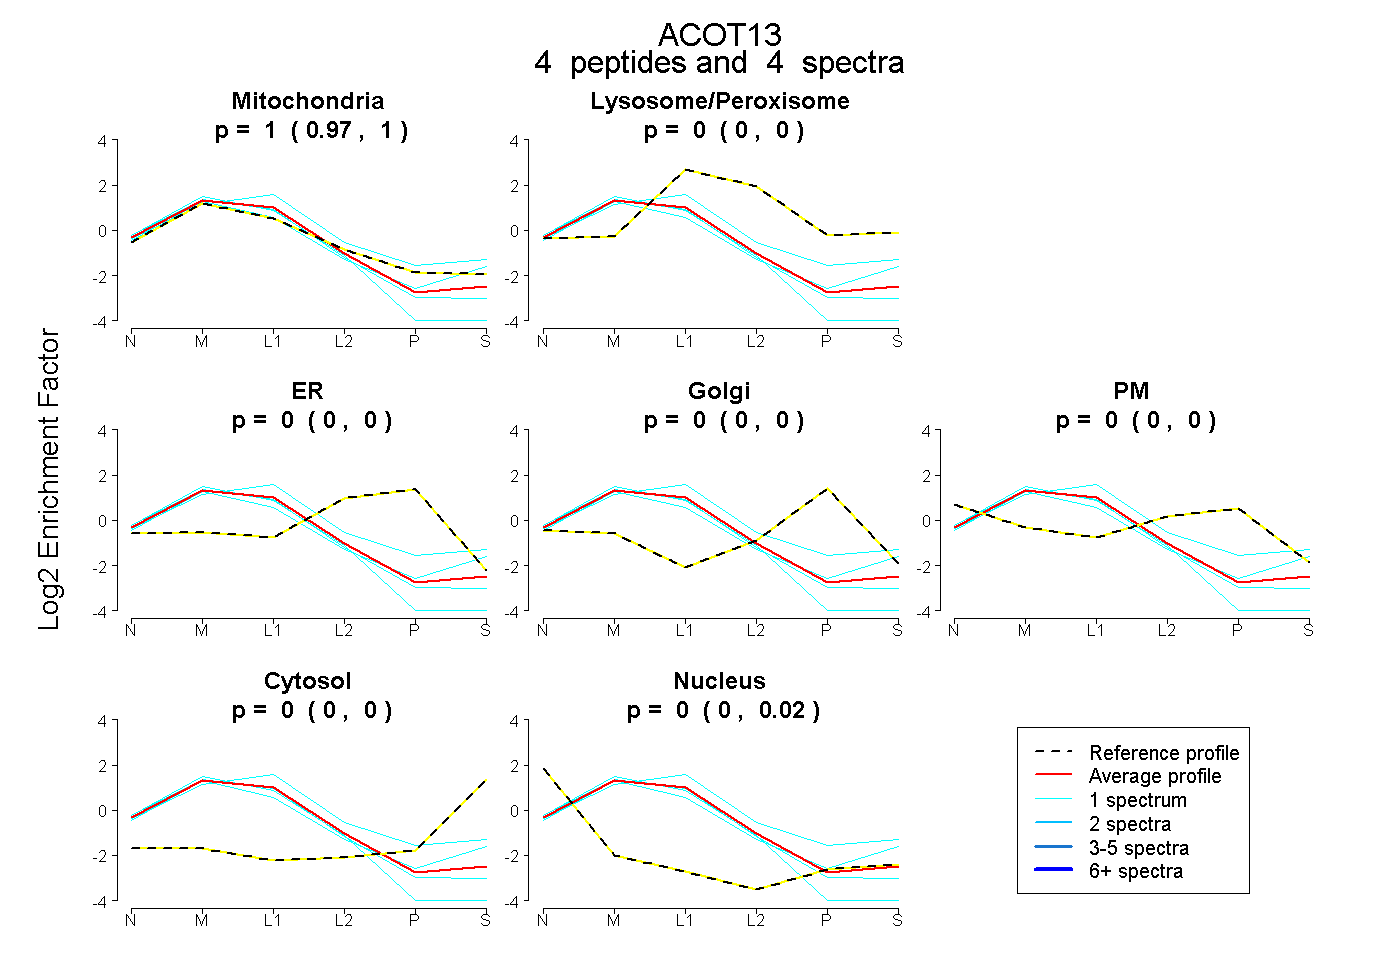
0.971 | 1.000
0.000 | 0.000
0.000 | 0.000
0.000 | 0.000
0.000 | 0.000
0.000 | 0.000
0.000 | 0.024
7peptides
spectra
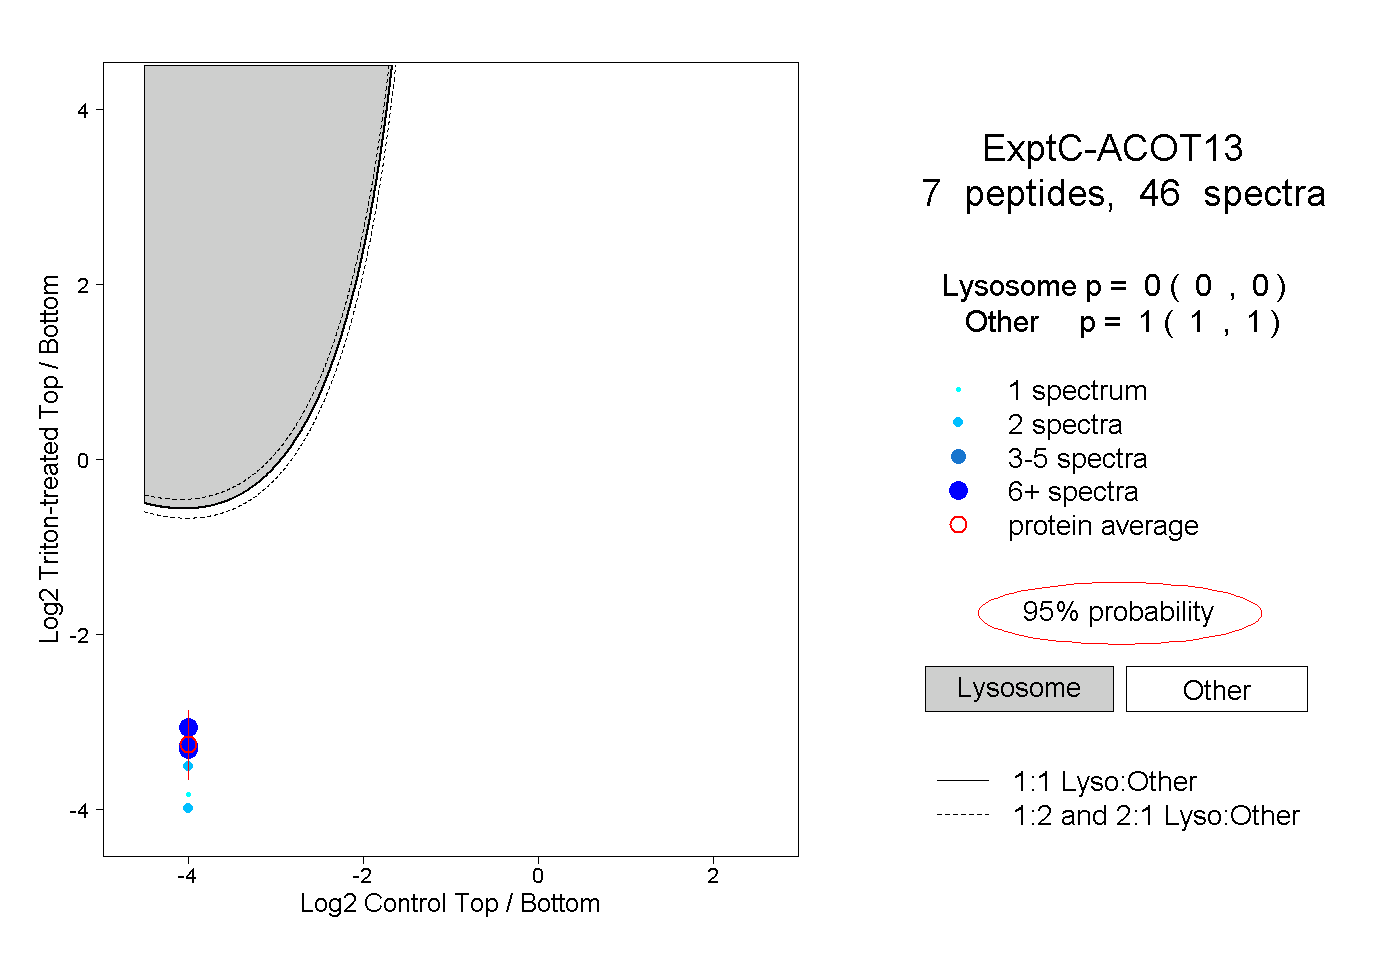
0.000 | 0.000
1.000 | 1.000
4peptides
spectra
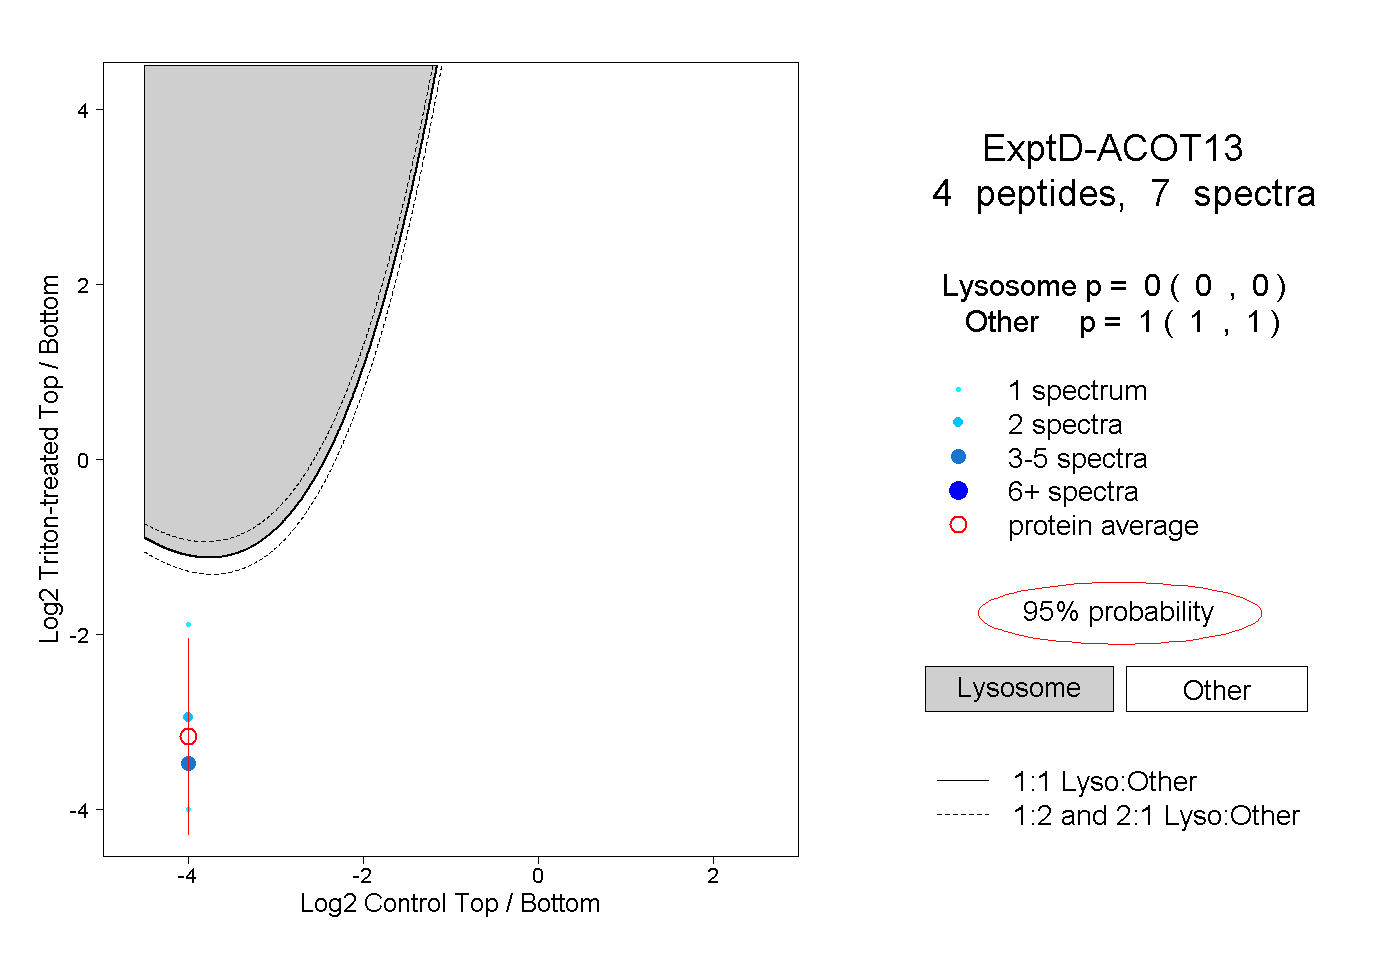
0.000 | 0.000
1.000 | 1.000