 3
3peptides
spectra
0.111 | 0.235
0.000 | 0.000
0.001 | 0.132
0.414 | 0.663
0.000 | 0.209
0.000 | 0.080
0.000 | 0.133
0.000 | 0.000
| Plot | Mito | Lyso | Perox | ER | Golgi | PM | Cytosol | Nucleus | |||||
| Expt A |
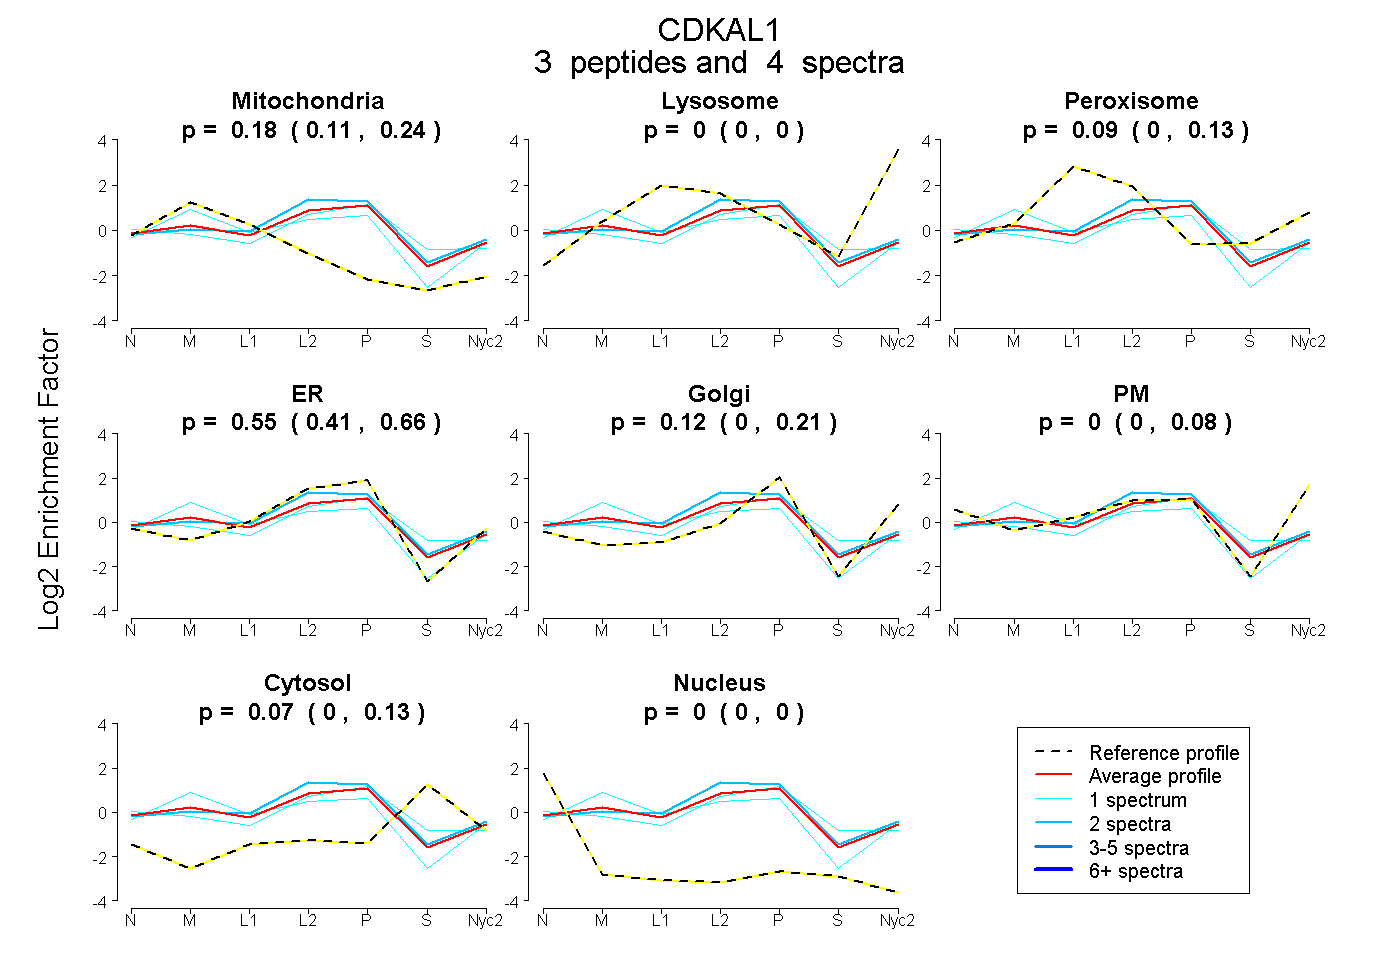
3 peptides |
4 spectra |
|
0.177 0.111 | 0.235 |
0.000 0.000 | 0.000 |
0.086 0.001 | 0.132 |
0.551 0.414 | 0.663 |
0.116 0.000 | 0.209 |
0.000 0.000 | 0.080 |
0.069 0.000 | 0.133 |
0.000 0.000 | 0.000 |
| 2 spectra, ILNHPR | 0.066 | 0.000 | 0.153 | 0.696 | 0.000 | 0.000 | 0.084 | 0.000 | ||
| 1 spectrum, GQPVSETR | 0.374 | 0.055 | 0.000 | 0.432 | 0.095 | 0.044 | 0.000 | 0.000 | ||
| 1 spectrum, FYVAHNR | 0.095 | 0.000 | 0.020 | 0.636 | 0.000 | 0.006 | 0.242 | 0.000 |