 7
7peptides
spectra
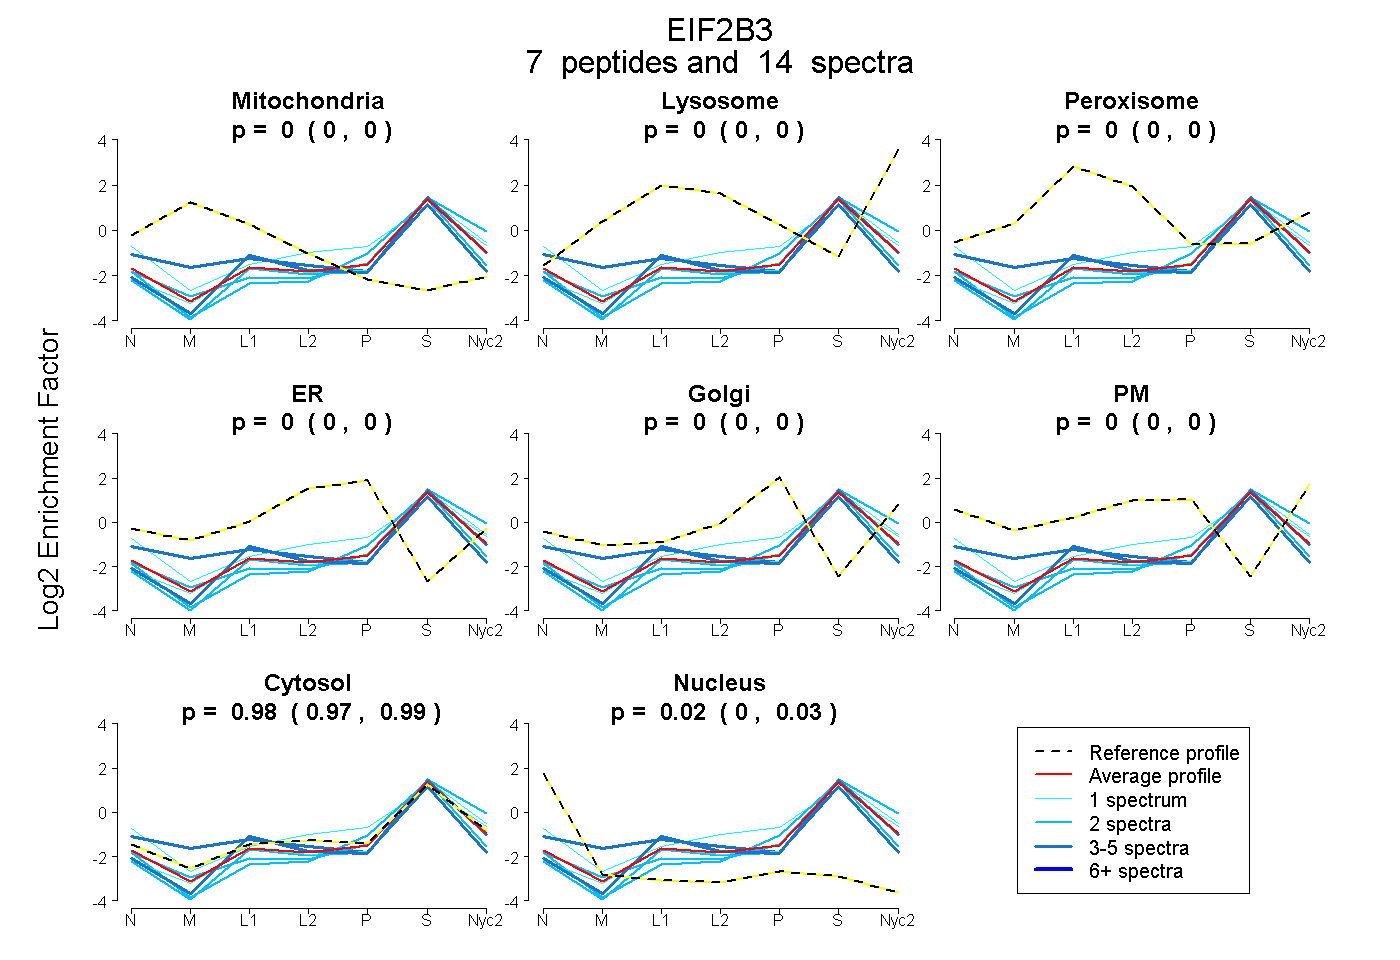
0.000 | 0.000
0.000 | 0.000
0.000 | 0.000
0.000 | 0.000
0.000 | 0.000
0.000 | 0.000
0.969 | 0.994
0.004 | 0.029
| Plot | Mito | Lyso | Perox | ER | Golgi | PM | Cytosol | Nucleus | |||||
| Expt A |
7 peptides |
14 spectra |
|
0.000 0.000 | 0.000 |
0.000 0.000 | 0.000 |
0.000 0.000 | 0.000 |
0.000 0.000 | 0.000 |
0.000 0.000 | 0.000 |
0.000 0.000 | 0.000 |
0.982 0.969 | 0.994 |
0.018 0.004 | 0.029 |
| 2 spectra, SELIPYLVR | 0.000 | 0.000 | 0.000 | 0.000 | 0.000 | 0.000 | 0.921 | 0.079 | ||
| 3 spectra, LKPDIVCIPDEADMGTADSLR | 0.141 | 0.000 | 0.000 | 0.000 | 0.000 | 0.000 | 0.813 | 0.046 | ||
| 1 spectrum, SVIGSSCVIR | 0.000 | 0.000 | 0.000 | 0.000 | 0.000 | 0.000 | 1.000 | 0.000 | ||
| 2 spectra, QFSSASSQQR | 0.000 | 0.000 | 0.000 | 0.000 | 0.000 | 0.000 | 0.967 | 0.033 | ||
| 1 spectrum, ALCAEFK | 0.000 | 0.000 | 0.000 | 0.000 | 0.104 | 0.014 | 0.876 | 0.007 | ||
| 2 spectra, DNTLTLAPYDACWNAFR | 0.000 | 0.000 | 0.000 | 0.000 | 0.000 | 0.000 | 1.000 | 0.000 | ||
| 3 spectra, YVVDFLMENK | 0.000 | 0.000 | 0.000 | 0.000 | 0.000 | 0.000 | 1.000 | 0.000 |
| Plot | Mito | Lyso or Perox | ER | Golgi | PM | Cytosol | Nucleus | ||||||
| Expt B |
2 peptides |
2 spectra |
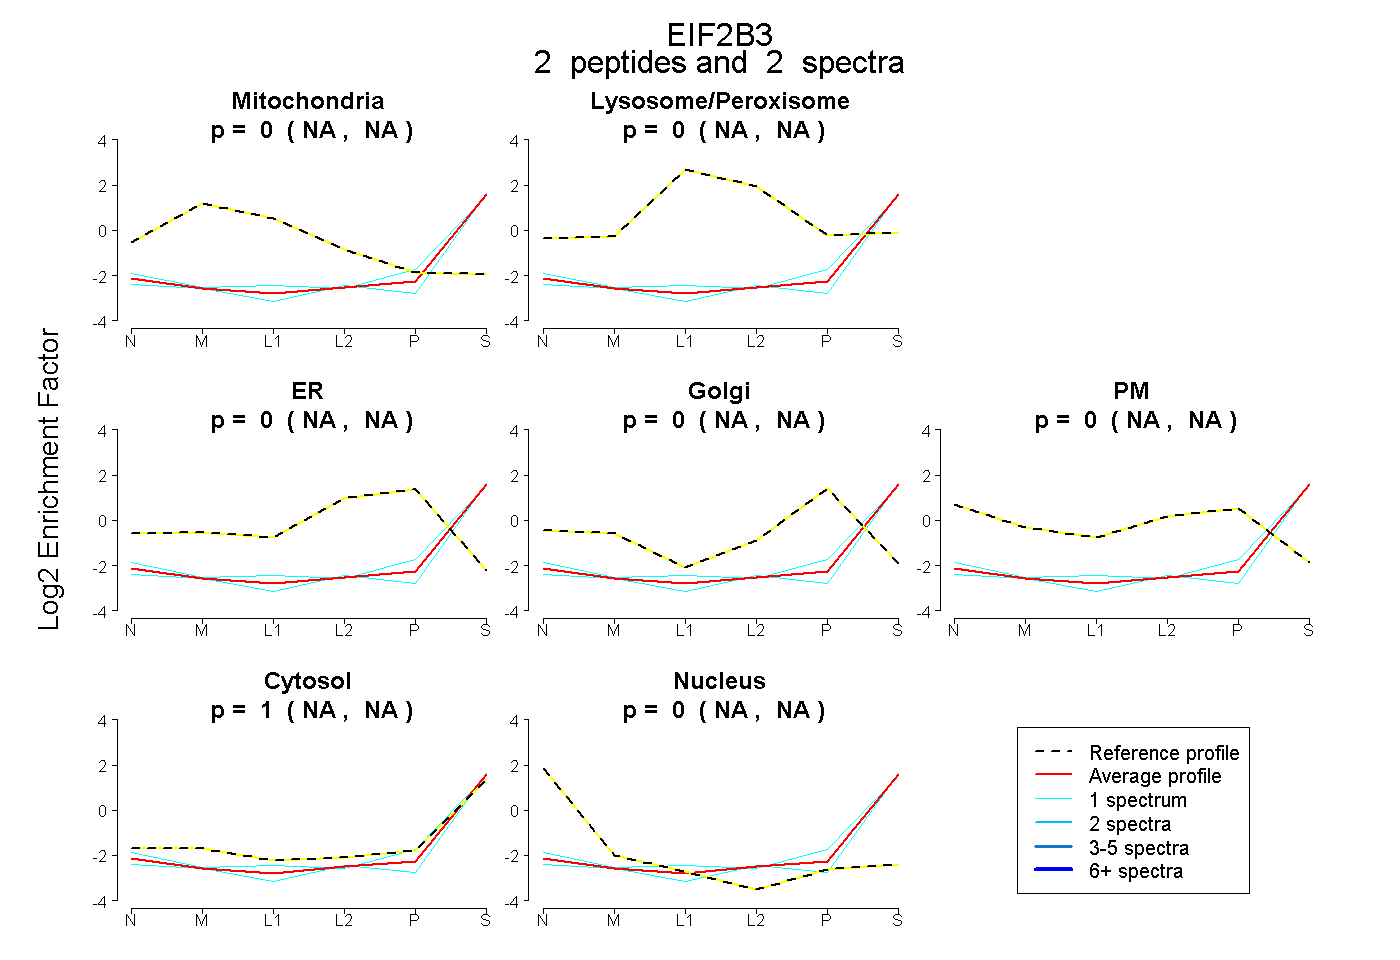 |
0.000 NA | NA |
0.000 NA | NA |
0.000 NA | NA |
0.000 NA | NA |
0.000 NA | NA |
1.000 NA | NA |
0.000 NA | NA |
|||
| Plot | Lyso | Other | |||||||||||
| Expt C |
1 peptide |
2 spectra |
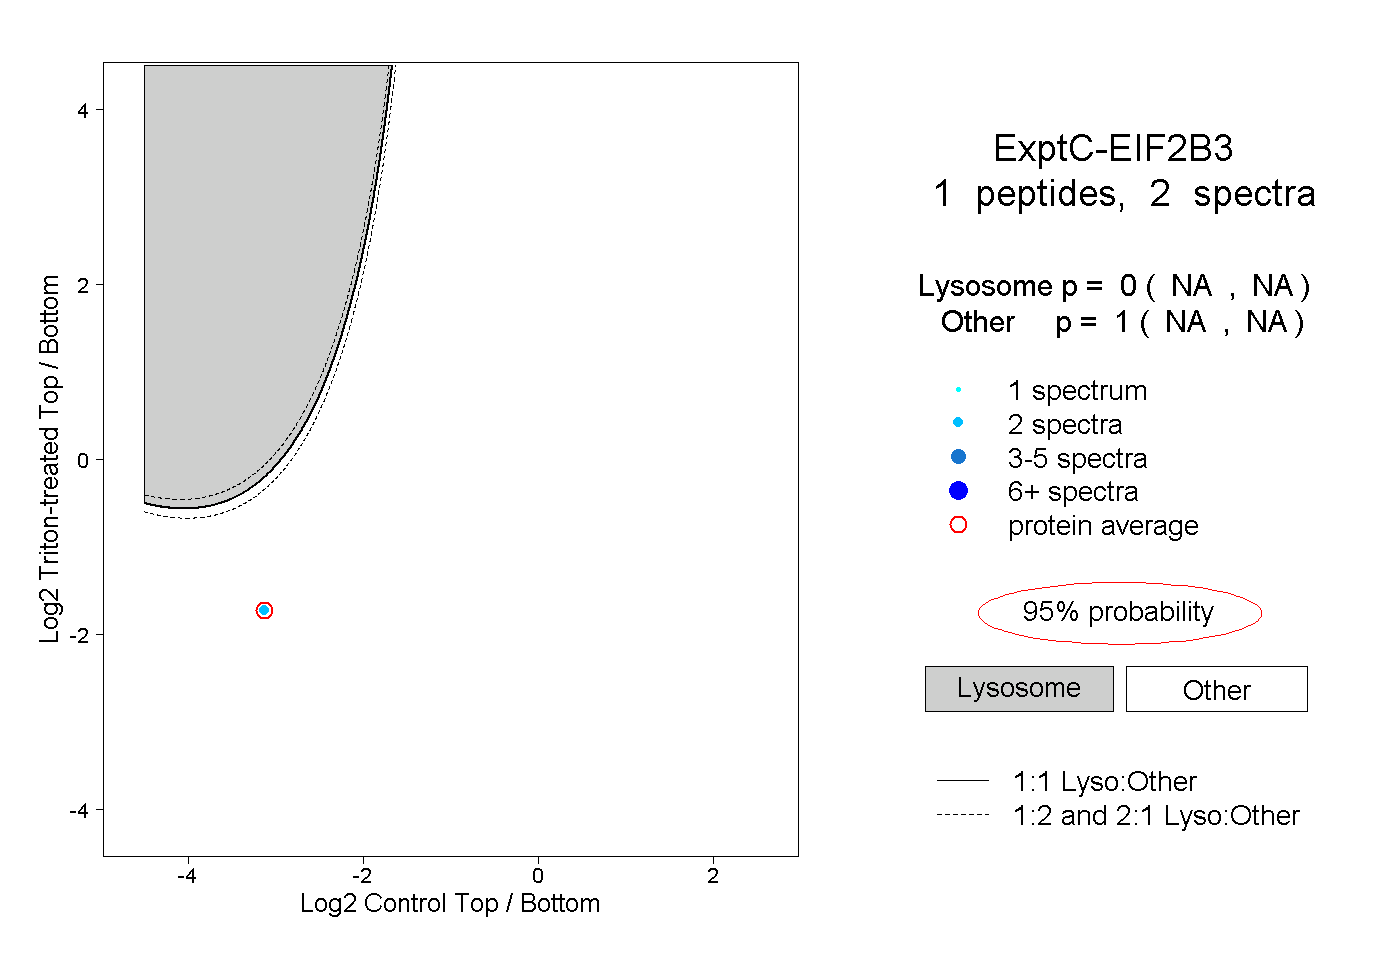 |
0.000 NA | NA |
1.000 NA | NA |