 12
12peptides
spectra
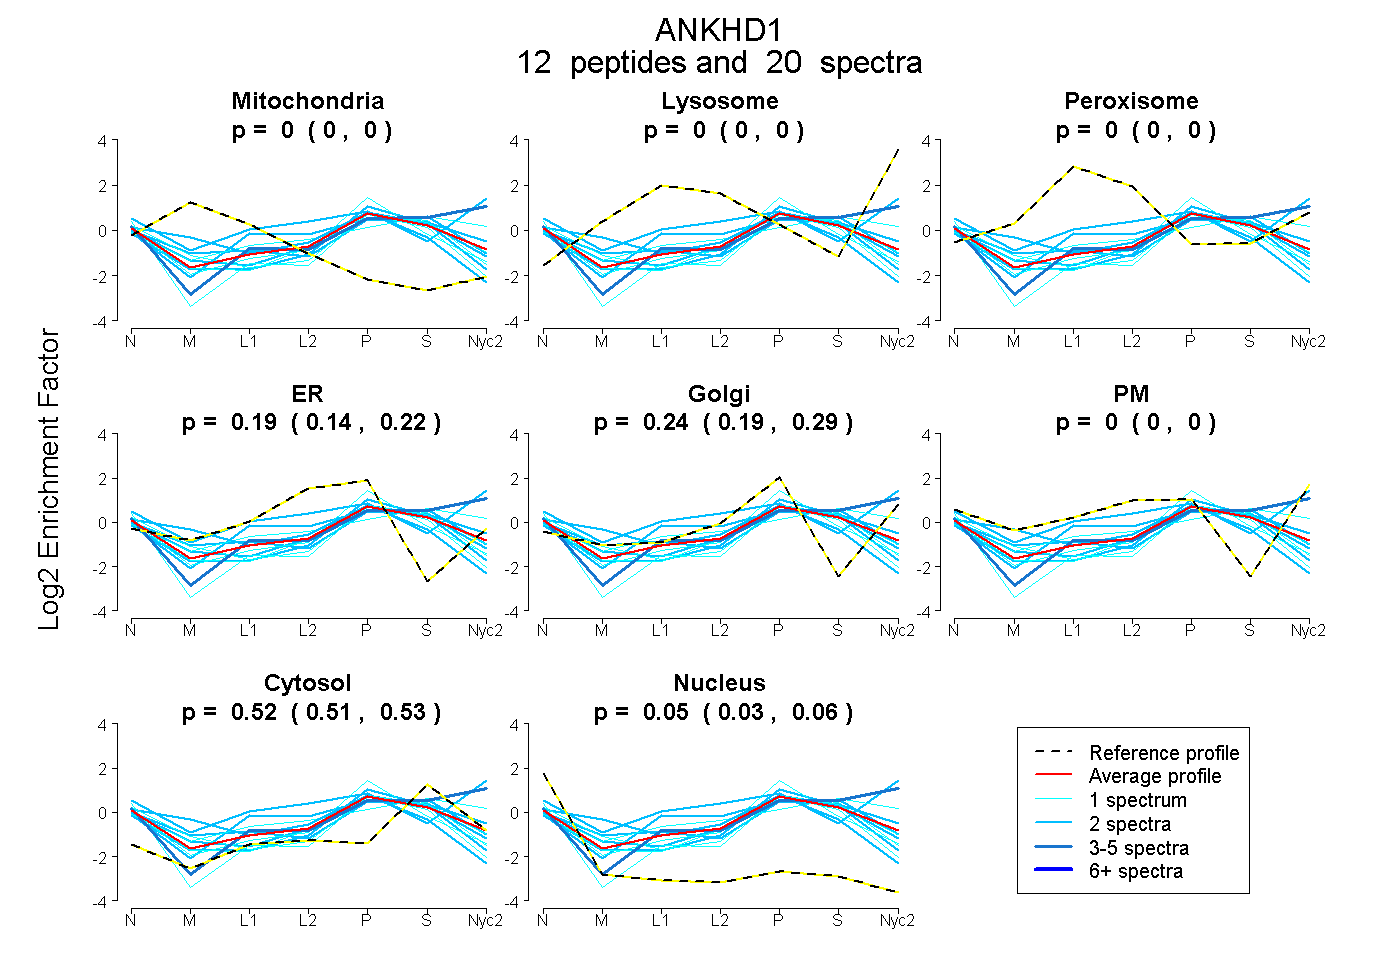
0.000 | 0.000
0.000 | 0.000
0.000 | 0.000
0.142 | 0.224
0.189 | 0.287
0.000 | 0.001
0.513 | 0.531
0.033 | 0.058
| Plot | Mito | Lyso | Perox | ER | Golgi | PM | Cytosol | Nucleus | |||||
| Expt A |
12 peptides |
20 spectra |
|
0.000 0.000 | 0.000 |
0.000 0.000 | 0.000 |
0.000 0.000 | 0.000 |
0.190 0.142 | 0.224 |
0.241 0.189 | 0.287 |
0.000 0.000 | 0.001 |
0.522 0.513 | 0.531 |
0.047 0.033 | 0.058 |
| 1 spectrum, LEALLEAAGIGK | 0.000 | 0.000 | 0.000 | 0.000 | 0.296 | 0.000 | 0.556 | 0.148 | ||
| 2 spectra, DHGLDK | 0.000 | 0.000 | 0.072 | 0.338 | 0.000 | 0.000 | 0.590 | 0.000 | ||
| 1 spectrum, LSVPASVVSR | 0.000 | 0.000 | 0.000 | 0.195 | 0.291 | 0.000 | 0.404 | 0.110 | ||
| 1 spectrum, GGDIEAQSER | 0.000 | 0.000 | 0.000 | 0.212 | 0.128 | 0.000 | 0.557 | 0.104 | ||
| 2 spectra, GADVNAPPVPSSR | 0.000 | 0.000 | 0.000 | 0.158 | 0.204 | 0.000 | 0.518 | 0.120 | ||
| 2 spectra, FCELLINR | 0.000 | 0.000 | 0.000 | 0.192 | 0.215 | 0.000 | 0.523 | 0.070 | ||
| 1 spectrum, LLLDMGSDINAQIETNR | 0.000 | 0.000 | 0.045 | 0.000 | 0.000 | 0.369 | 0.586 | 0.000 | ||
| 2 spectra, APGFRPPSQR | 0.000 | 0.072 | 0.013 | 0.000 | 0.000 | 0.651 | 0.264 | 0.000 | ||
| 2 spectra, NTALTLACFQGR | 0.171 | 0.000 | 0.000 | 0.394 | 0.000 | 0.000 | 0.329 | 0.106 | ||
| 3 spectra, TVDPETQAR | 0.000 | 0.000 | 0.000 | 0.000 | 0.142 | 0.275 | 0.583 | 0.000 | ||
| 2 spectra, GHLDMVR | 0.070 | 0.000 | 0.017 | 0.000 | 0.345 | 0.039 | 0.528 | 0.000 | ||
| 1 spectrum, QEVVDLLLAR | 0.000 | 0.000 | 0.000 | 0.208 | 0.141 | 0.000 | 0.450 | 0.201 |
| Plot | Lyso | Other | |||||||||||
| Expt C |
5 peptides |
9 spectra |
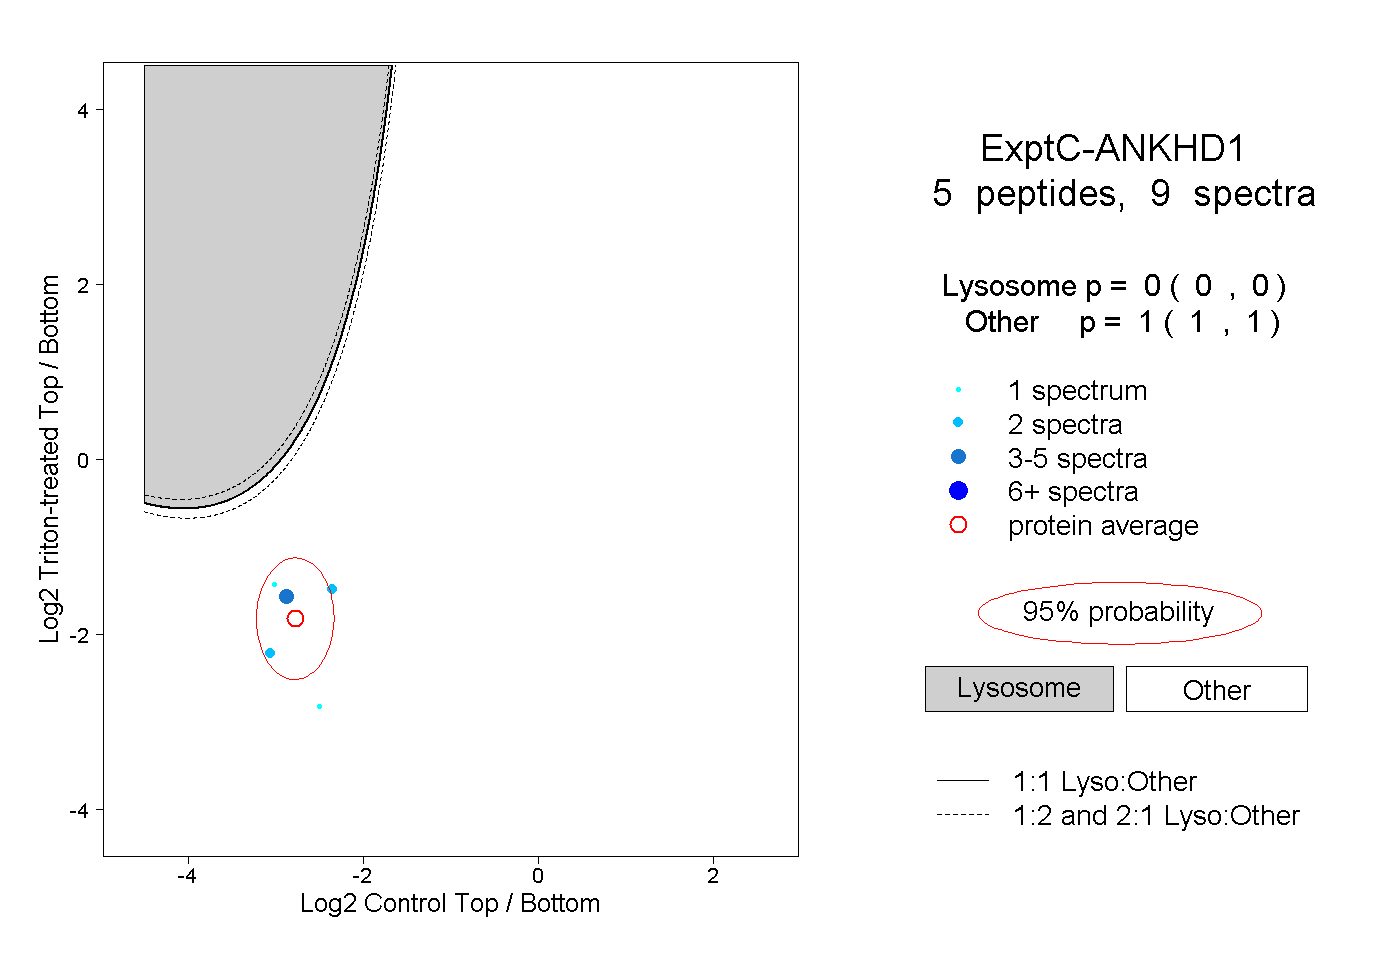 |
0.000 0.000 | 0.000 |
1.000 1.000 | 1.000 |