 3
3peptides
spectra
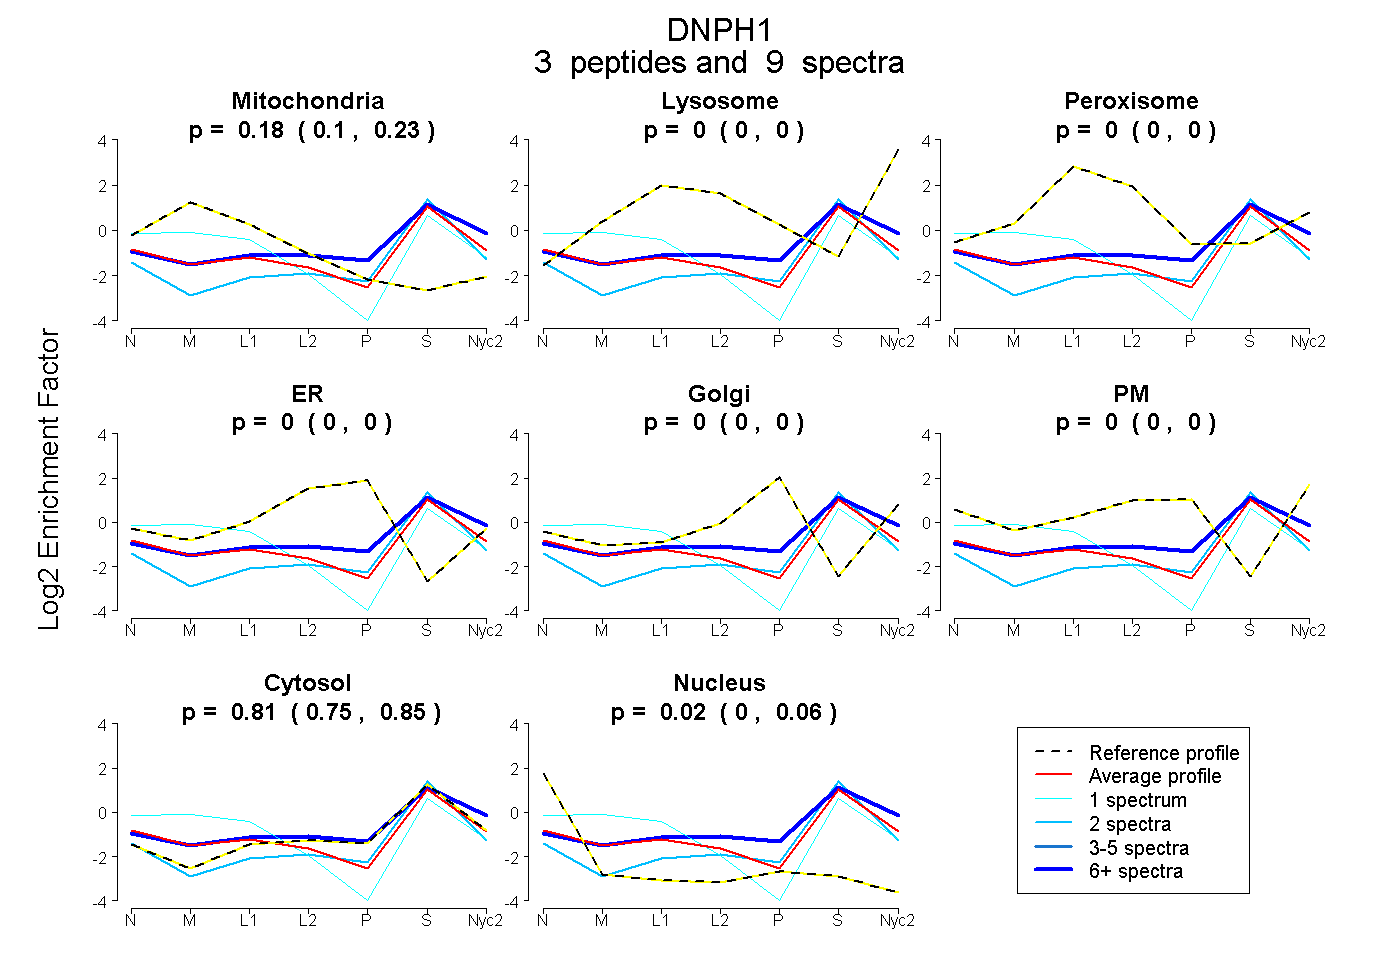
0.096 | 0.235
0.000 | 0.000
0.000 | 0.000
0.000 | 0.000
0.000 | 0.000
0.000 | 0.000
0.745 | 0.848
0.000 | 0.064
2peptides
spectra
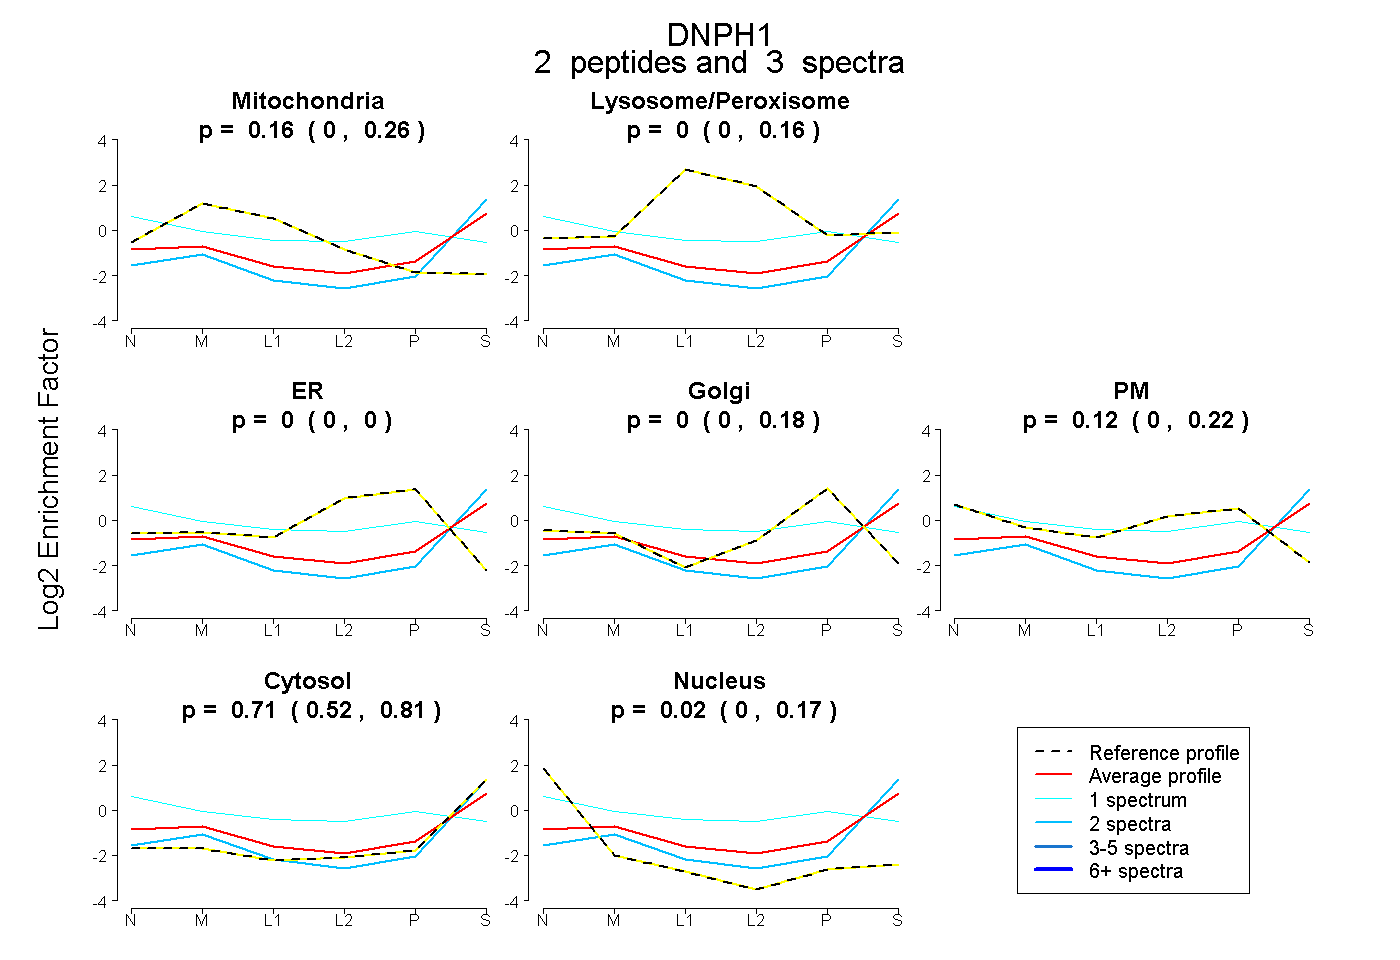
0.000 | 0.257
0.000 | 0.155
0.000 | 0.000
0.000 | 0.183
0.000 | 0.222
0.524 | 0.811
0.000 | 0.168
3peptides
spectra
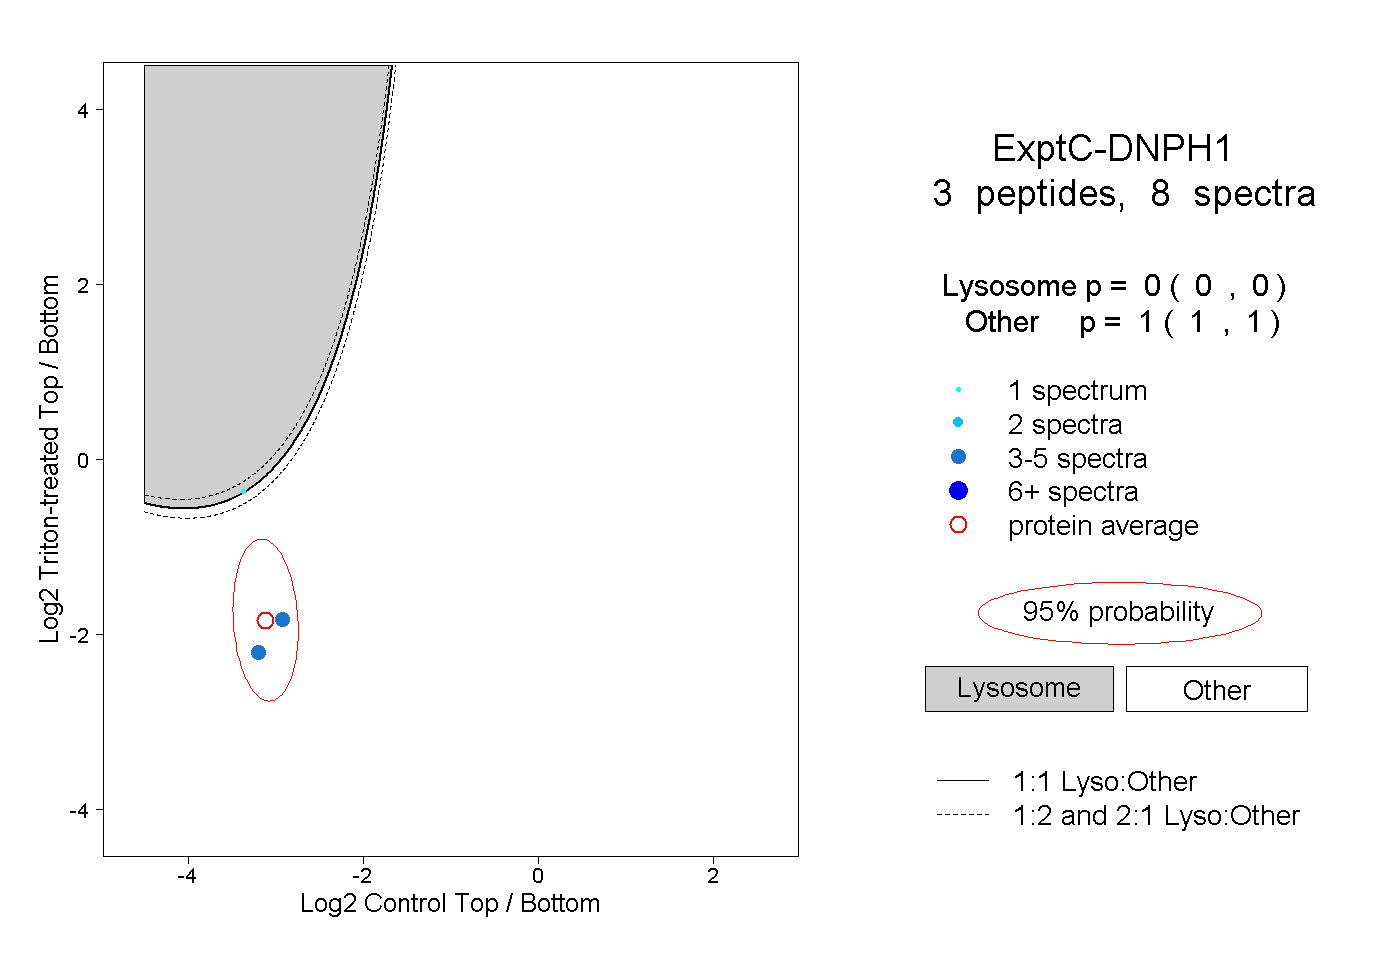
0.000 | 0.000
1.000 | 1.000