 1
1peptide
spectra
0.000 | 0.000
0.000 | 0.000
0.000 | 0.000
0.042 | 0.423
0.000 | 0.251
0.000 | 0.051
0.407 | 0.583
0.000 | 0.202
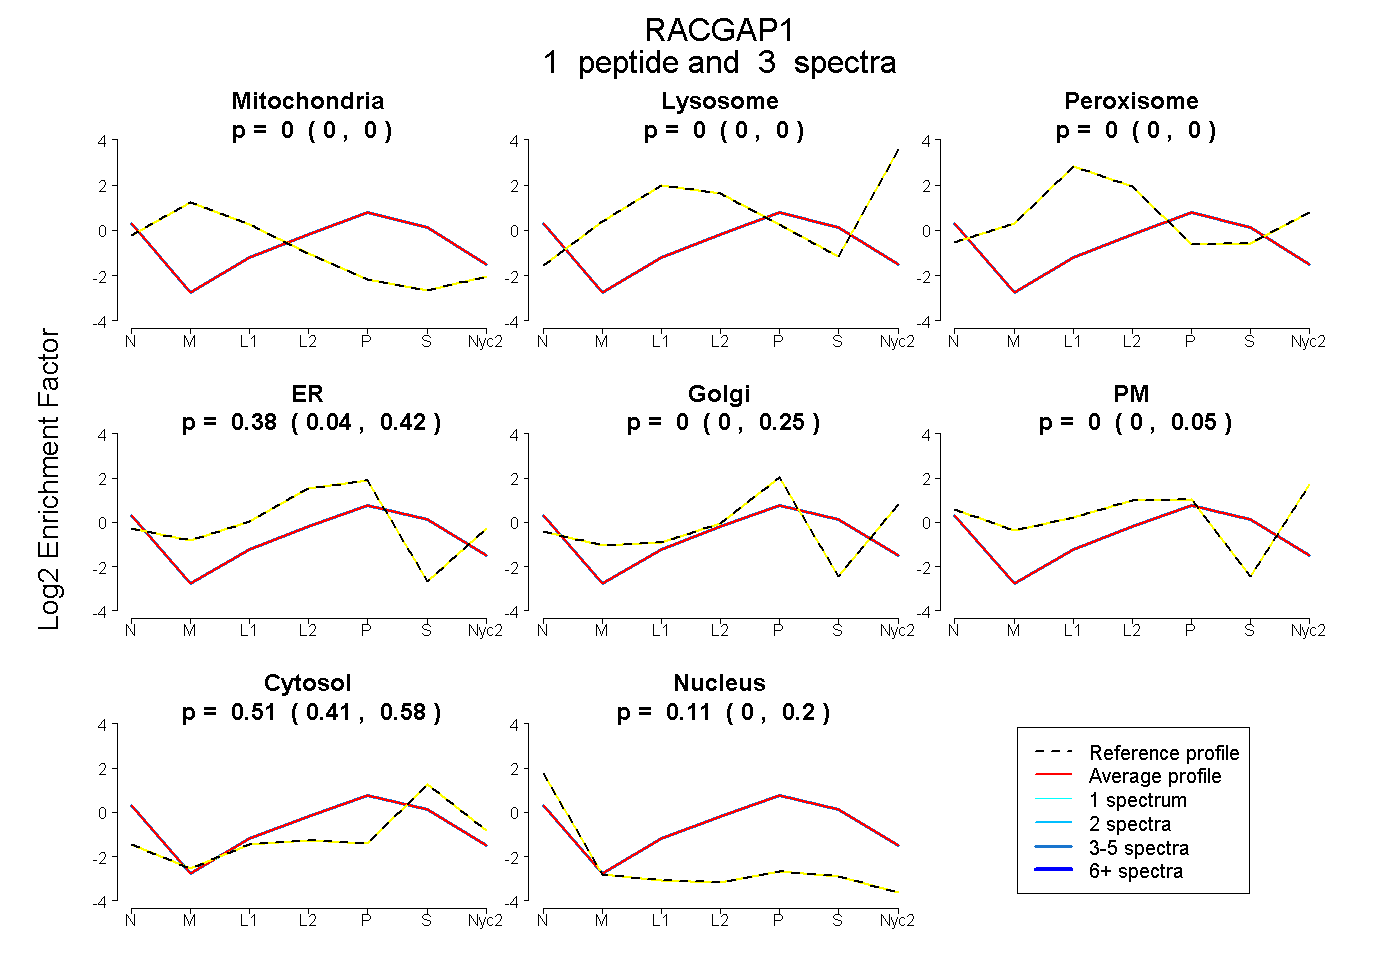
| Plot | Mito | Lyso | Perox | ER | Golgi | PM | Cytosol | Nucleus | |||||
| Expt A |
1 peptide |
3 spectra |
|
0.000 0.000 | 0.000 |
0.000 0.000 | 0.000 |
0.000 0.000 | 0.000 |
0.379 0.042 | 0.423 |
0.000 0.000 | 0.251 |
0.000 0.000 | 0.051 |
0.512 0.407 | 0.583 |
0.109 0.000 | 0.202 |