 14
14peptides
spectra
0.000 | 0.000
0.000 | 0.000
0.000 | 0.000
0.007 | 0.077
0.066 | 0.144
0.000 | 0.000
0.693 | 0.703
0.140 | 0.156
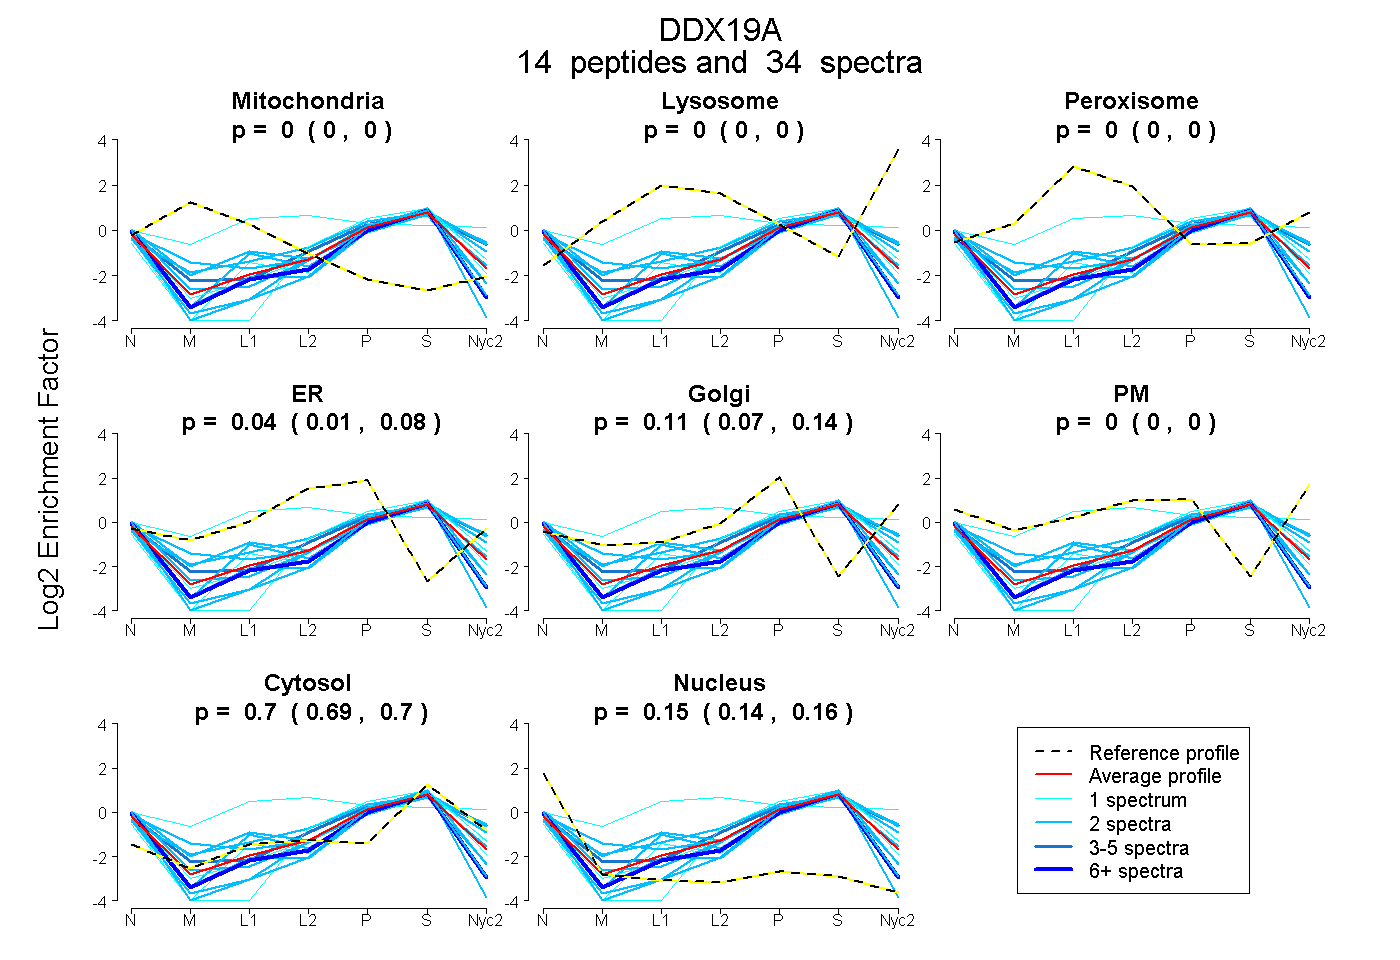
| Plot | Mito | Lyso | Perox | ER | Golgi | PM | Cytosol | Nucleus | |||||
| Expt A |
14 peptides |
34 spectra |
|
0.000 0.000 | 0.000 |
0.000 0.000 | 0.000 |
0.000 0.000 | 0.000 |
0.043 0.007 | 0.077 |
0.110 0.066 | 0.144 |
0.000 0.000 | 0.000 |
0.698 0.693 | 0.703 |
0.149 0.140 | 0.156 |
| 1 spectrum, LDTDDLDEIEK | 0.000 | 0.000 | 0.000 | 0.000 | 0.150 | 0.000 | 0.722 | 0.129 | ||
| 1 spectrum, EGHQVALLSGEMMVEQR | 0.000 | 0.000 | 0.362 | 0.122 | 0.000 | 0.177 | 0.340 | 0.000 | ||
| 1 spectrum, EEETLDTIK | 0.000 | 0.000 | 0.000 | 0.000 | 0.047 | 0.000 | 0.796 | 0.156 | ||
| 2 spectra, VVPDPNIIK | 0.000 | 0.000 | 0.000 | 0.000 | 0.000 | 0.000 | 0.668 | 0.332 | ||
| 2 spectra, HSMNILNR | 0.000 | 0.000 | 0.000 | 0.149 | 0.158 | 0.000 | 0.690 | 0.003 | ||
| 4 spectra, DGNPDNETYLHR | 0.000 | 0.000 | 0.000 | 0.000 | 0.286 | 0.000 | 0.657 | 0.057 | ||
| 2 spectra, FHPELK | 0.000 | 0.000 | 0.000 | 0.000 | 0.185 | 0.000 | 0.745 | 0.070 | ||
| 2 spectra, VIEQMGK | 0.000 | 0.000 | 0.000 | 0.095 | 0.036 | 0.000 | 0.627 | 0.242 | ||
| 2 spectra, QYYVLCNNR | 0.000 | 0.000 | 0.000 | 0.000 | 0.011 | 0.000 | 0.756 | 0.234 | ||
| 2 spectra, VFVLDEADVMIATQGHQDQSIR | 0.000 | 0.000 | 0.000 | 0.000 | 0.000 | 0.000 | 0.674 | 0.326 | ||
| 2 spectra, IQEHFNK | 0.010 | 0.000 | 0.000 | 0.106 | 0.118 | 0.000 | 0.644 | 0.123 | ||
| 1 spectrum, LKPQLLQGVYAMGFNRPSK | 0.000 | 0.000 | 0.000 | 0.000 | 0.119 | 0.000 | 0.749 | 0.132 | ||
| 10 spectra, VLVTTNVCAR | 0.000 | 0.000 | 0.000 | 0.022 | 0.000 | 0.000 | 0.691 | 0.287 | ||
| 2 spectra, DPSSPLYSVK | 0.000 | 0.000 | 0.000 | 0.000 | 0.090 | 0.176 | 0.684 | 0.050 |
| Plot | Mito | Lyso or Perox | ER | Golgi | PM | Cytosol | Nucleus | ||||||
| Expt B |
5 peptides |
10 spectra |
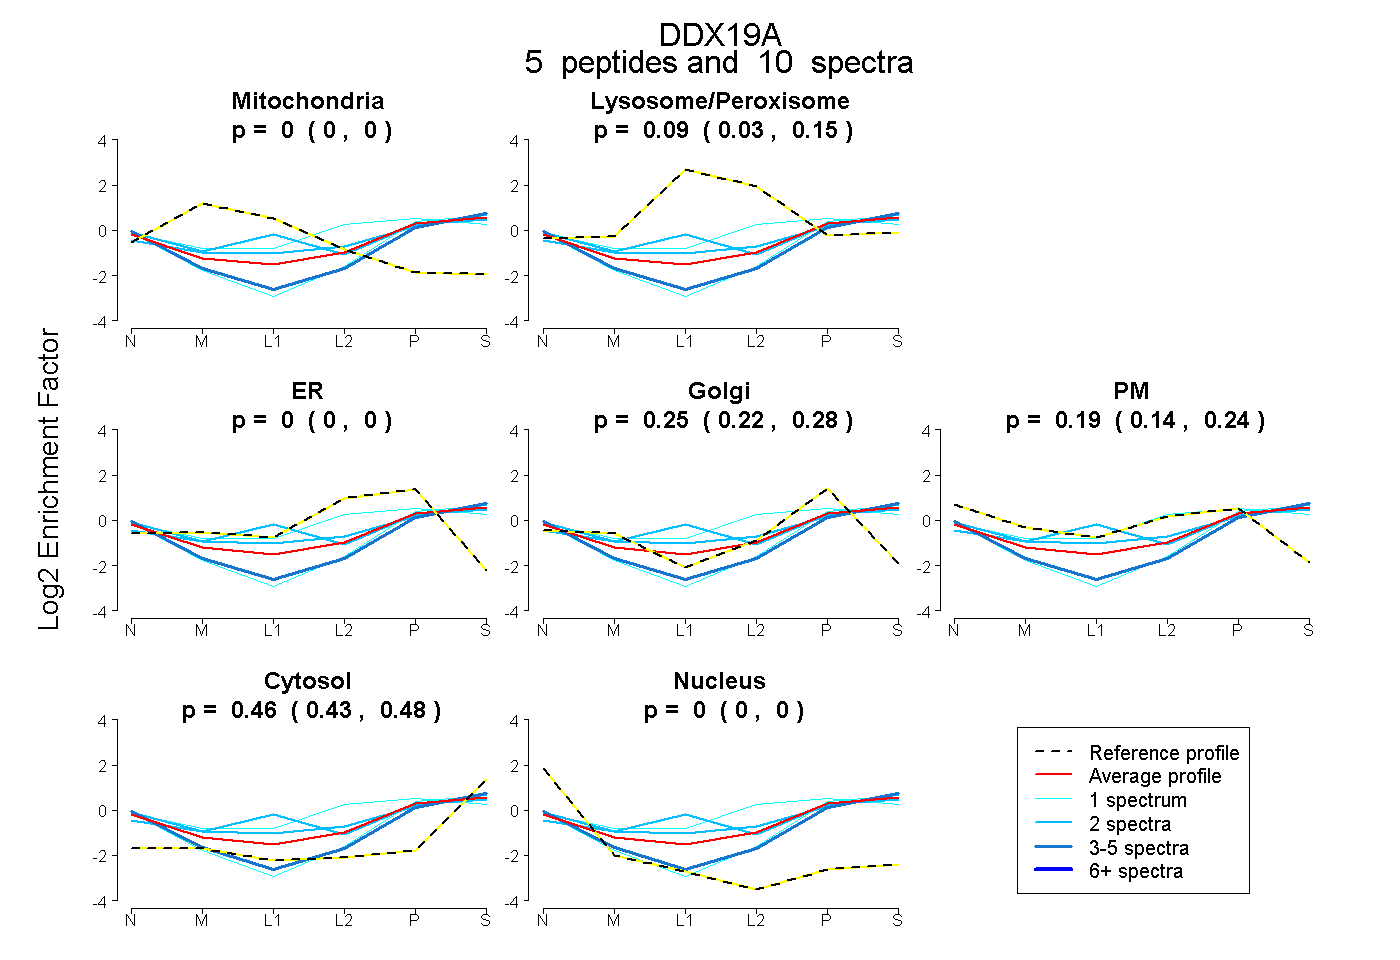 |
0.000 0.000 | 0.000 |
0.095 0.029 | 0.145 |
0.000 0.000 | 0.000 |
0.253 0.220 | 0.279 |
0.194 0.137 | 0.244 |
0.458 0.434 | 0.480 |
0.000 0.000 | 0.000 |
|||
| Plot | Lyso | Other | |||||||||||
| Expt C |
10 peptides |
25 spectra |
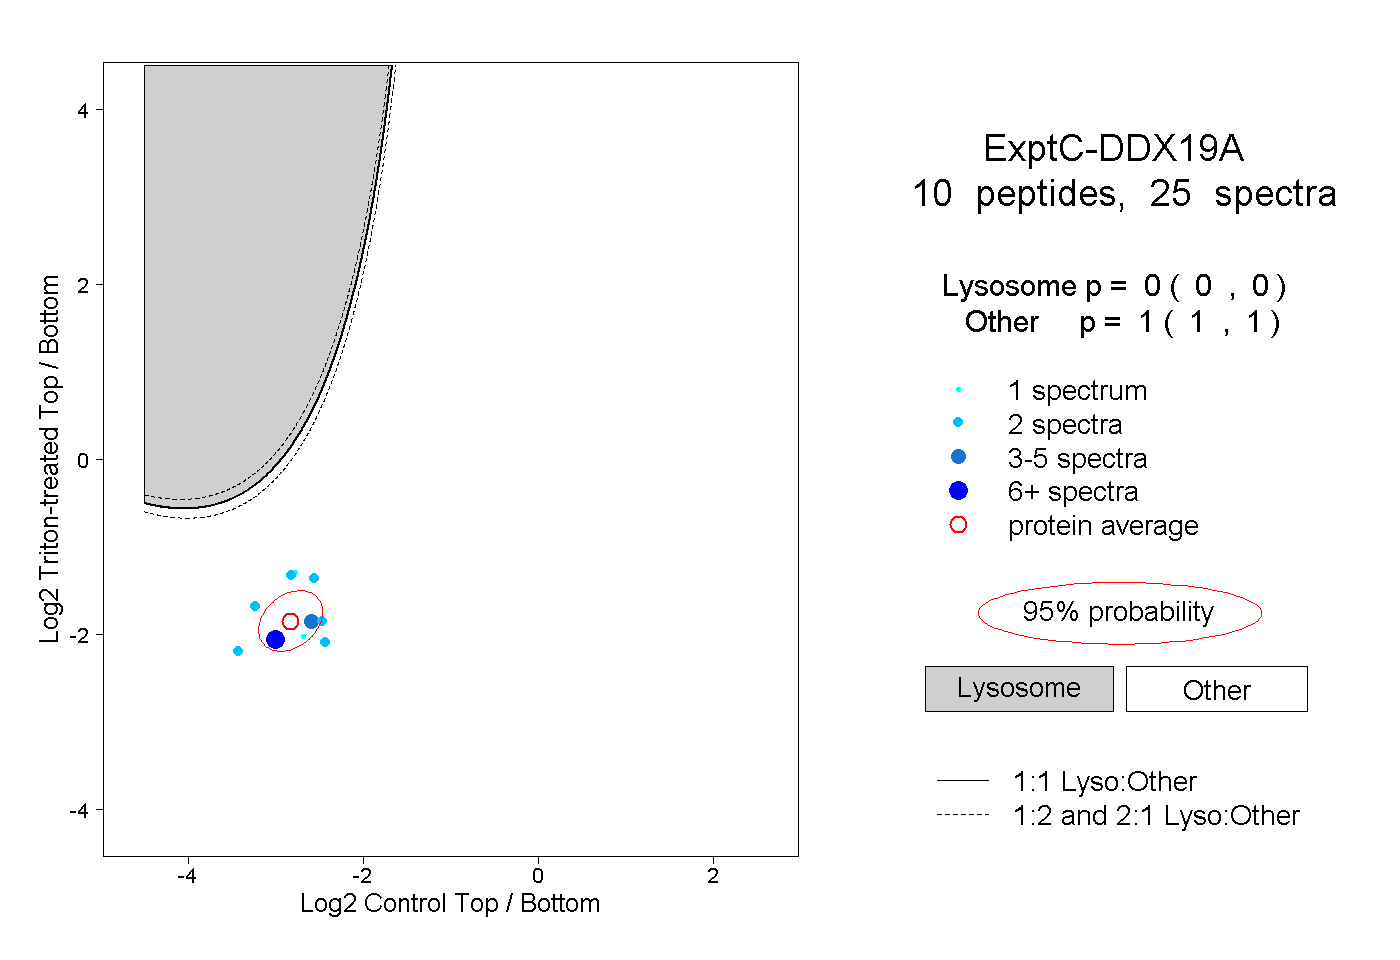 |
0.000 0.000 | 0.000 |
1.000 1.000 | 1.000 |
||||||||
| Plot | Lyso | Other | |||||||||||
| Expt D |
1 peptide |
2 spectra |
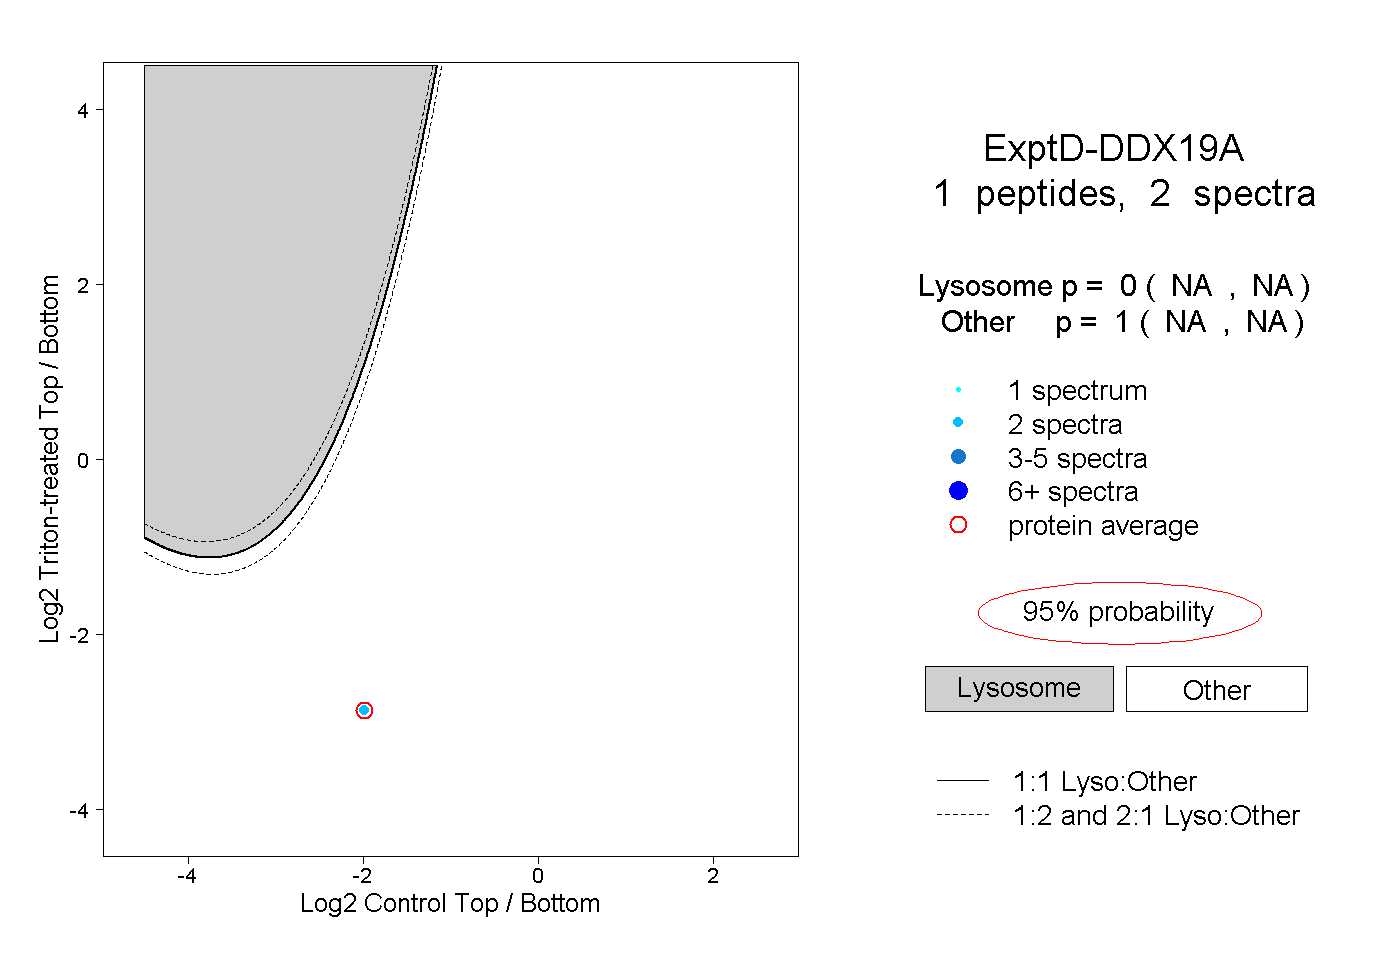 |
0.000 NA | NA |
1.000 NA | NA |