 2
2peptides
spectra
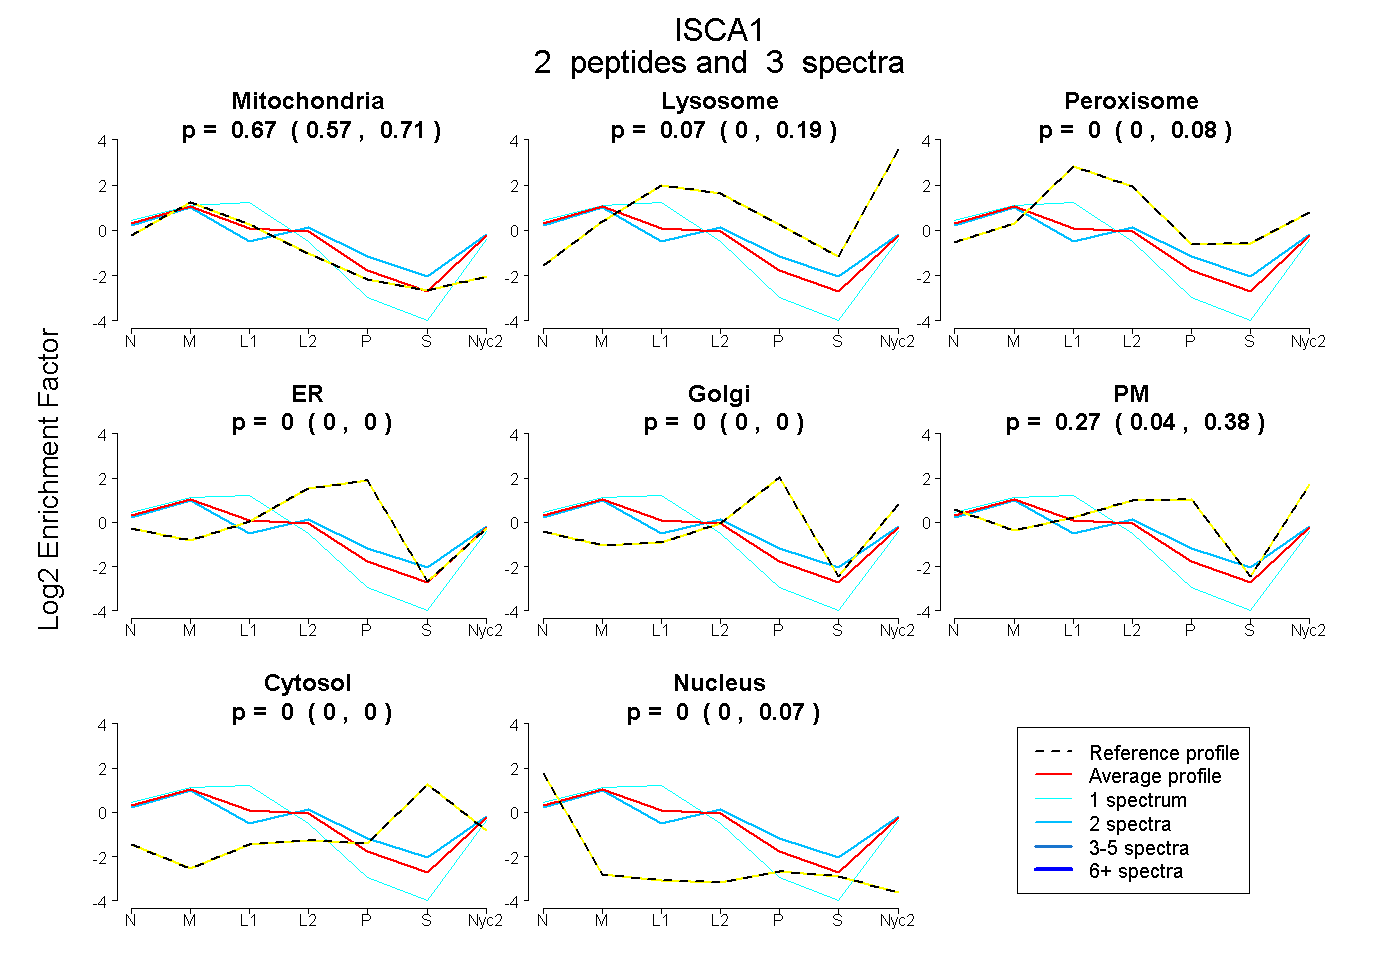
0.571 | 0.713
0.000 | 0.185
0.000 | 0.080
0.000 | 0.000
0.000 | 0.000
0.041 | 0.378
0.000 | 0.000
0.000 | 0.065
3peptides
spectra
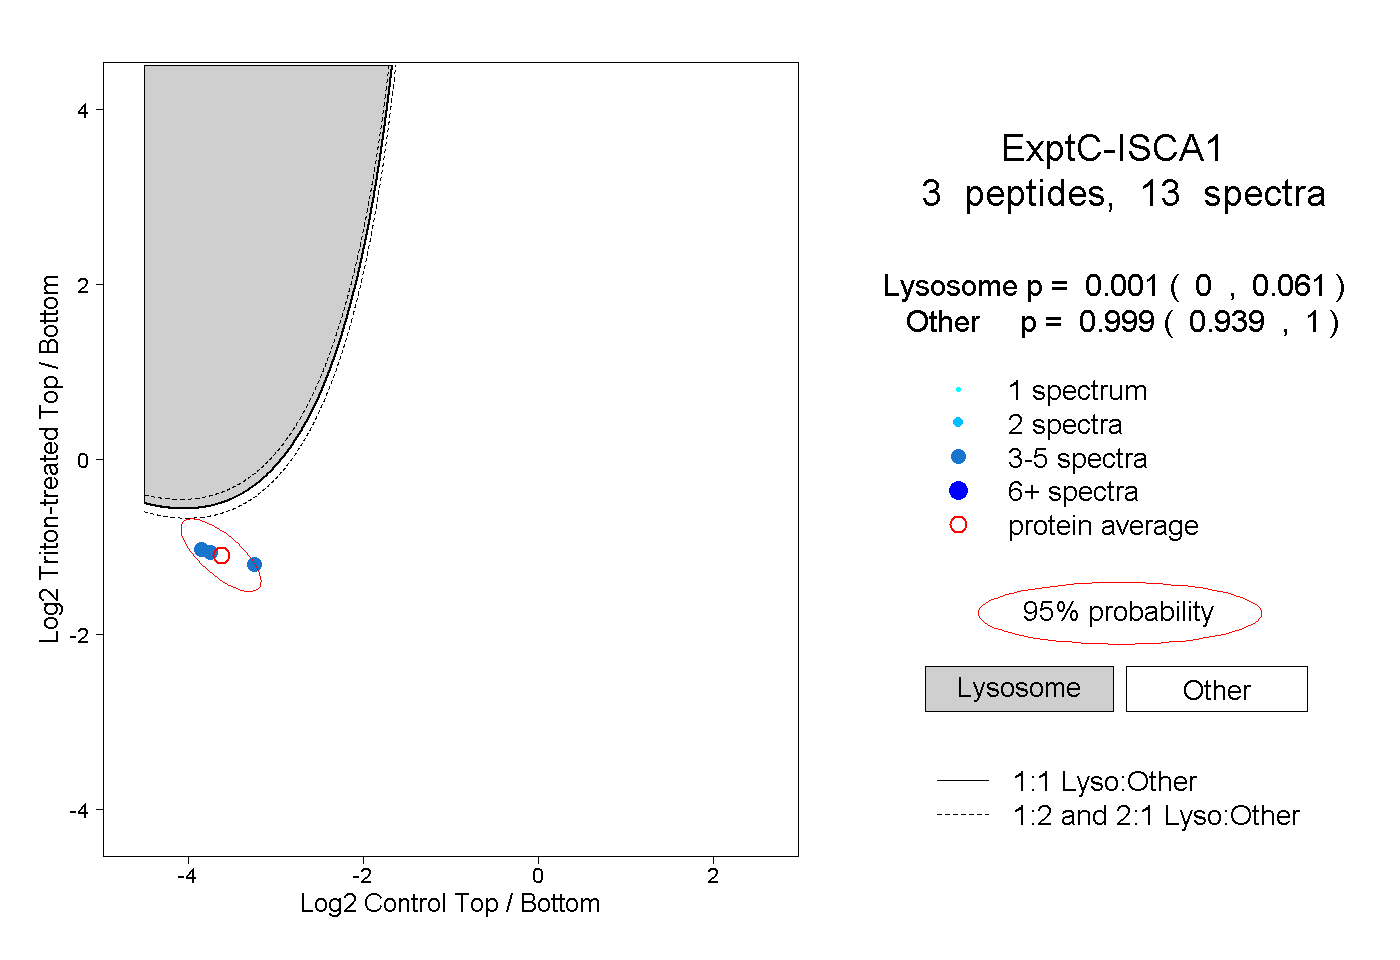
0.000 | 0.061
0.939 | 1.000
1peptide
spectrum
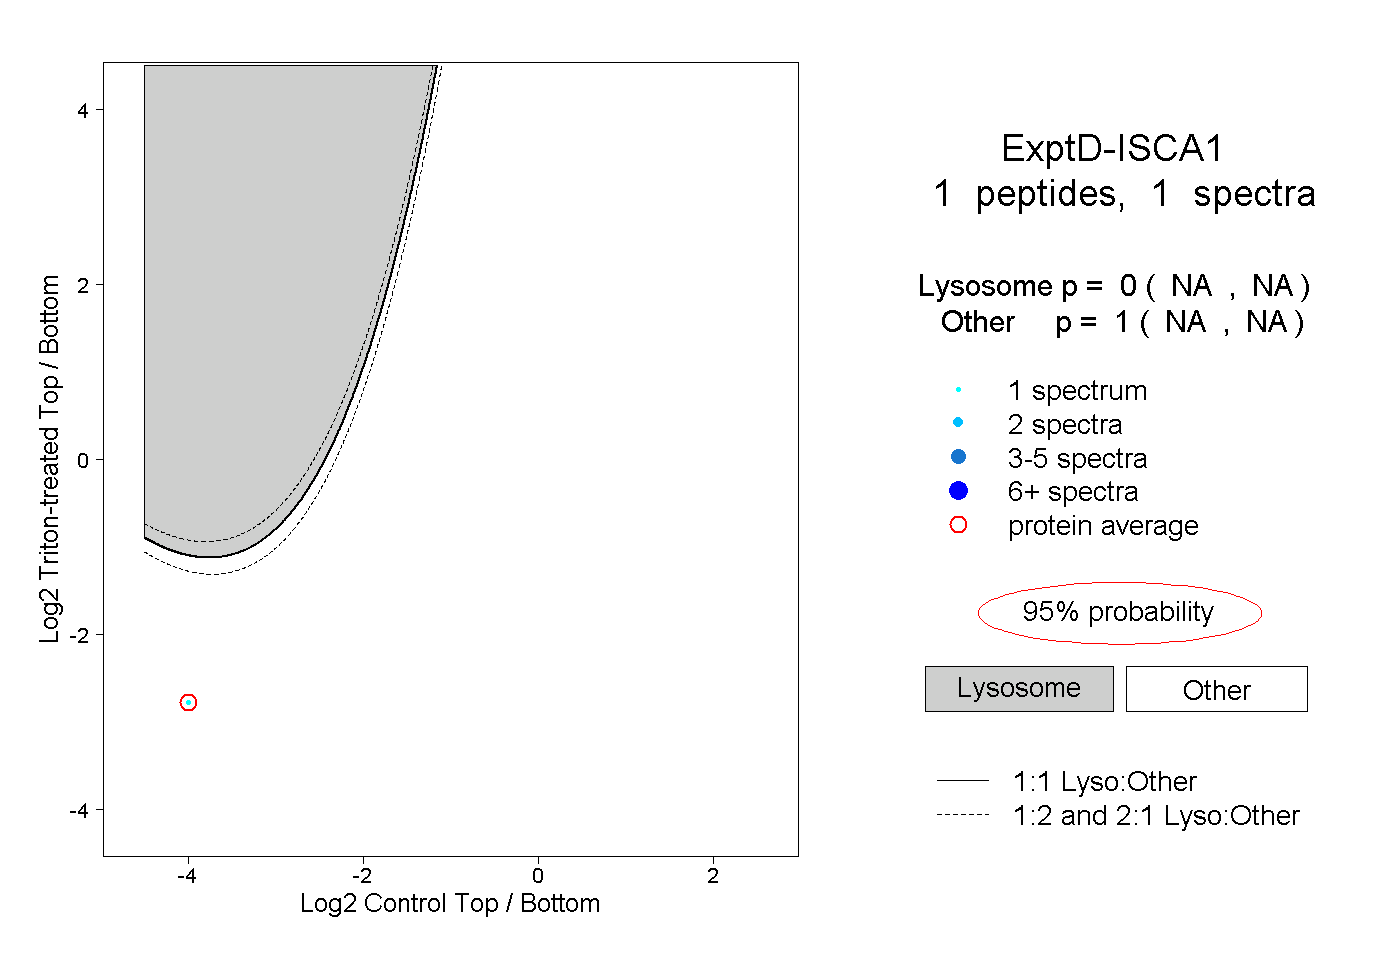
NA | NA
NA | NA