21
21peptides
spectra
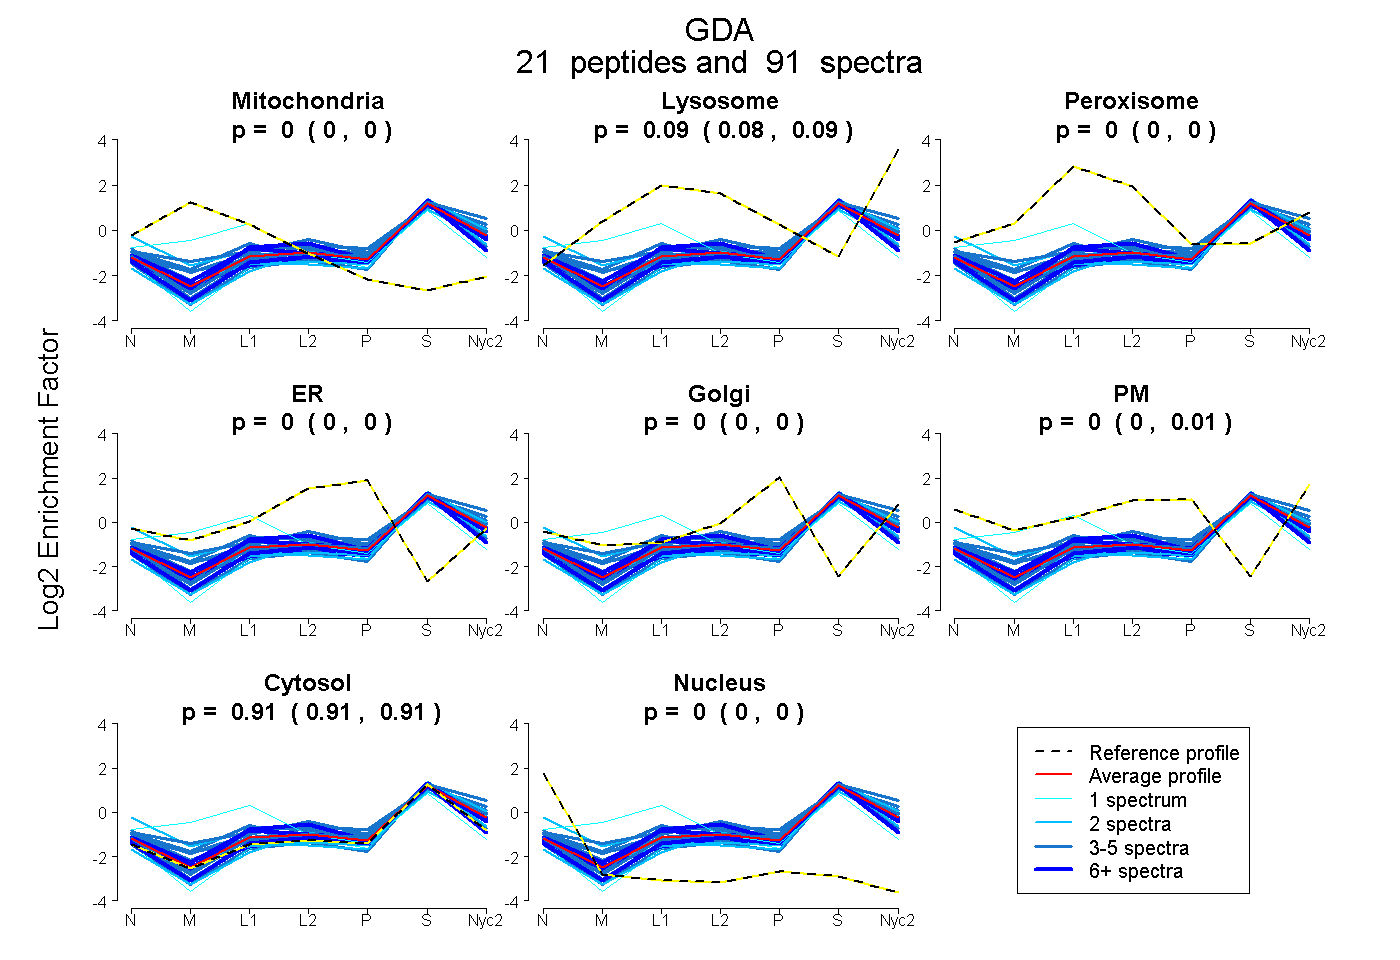
0.000 | 0.000
0.081 | 0.088
0.000 | 0.000
0.000 | 0.000
0.000 | 0.000
0.000 | 0.005
0.910 | 0.914
0.000 | 0.000
11peptides
spectra
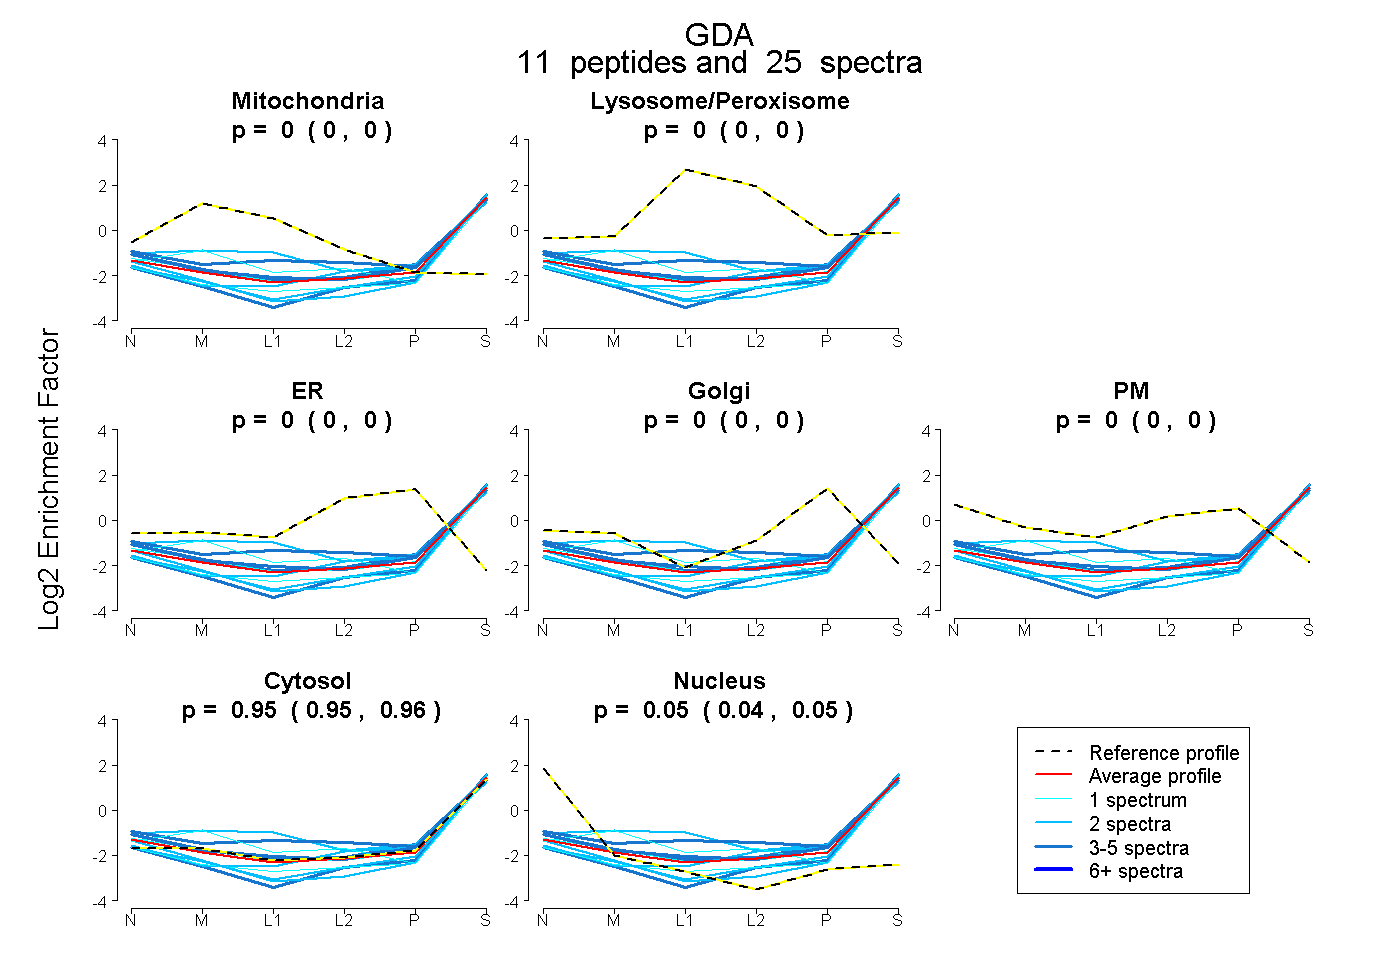
0.000 | 0.000
0.000 | 0.000
0.000 | 0.000
0.000 | 0.000
0.000 | 0.000
0.947 | 0.956
0.043 | 0.053