 19
19peptides
spectra
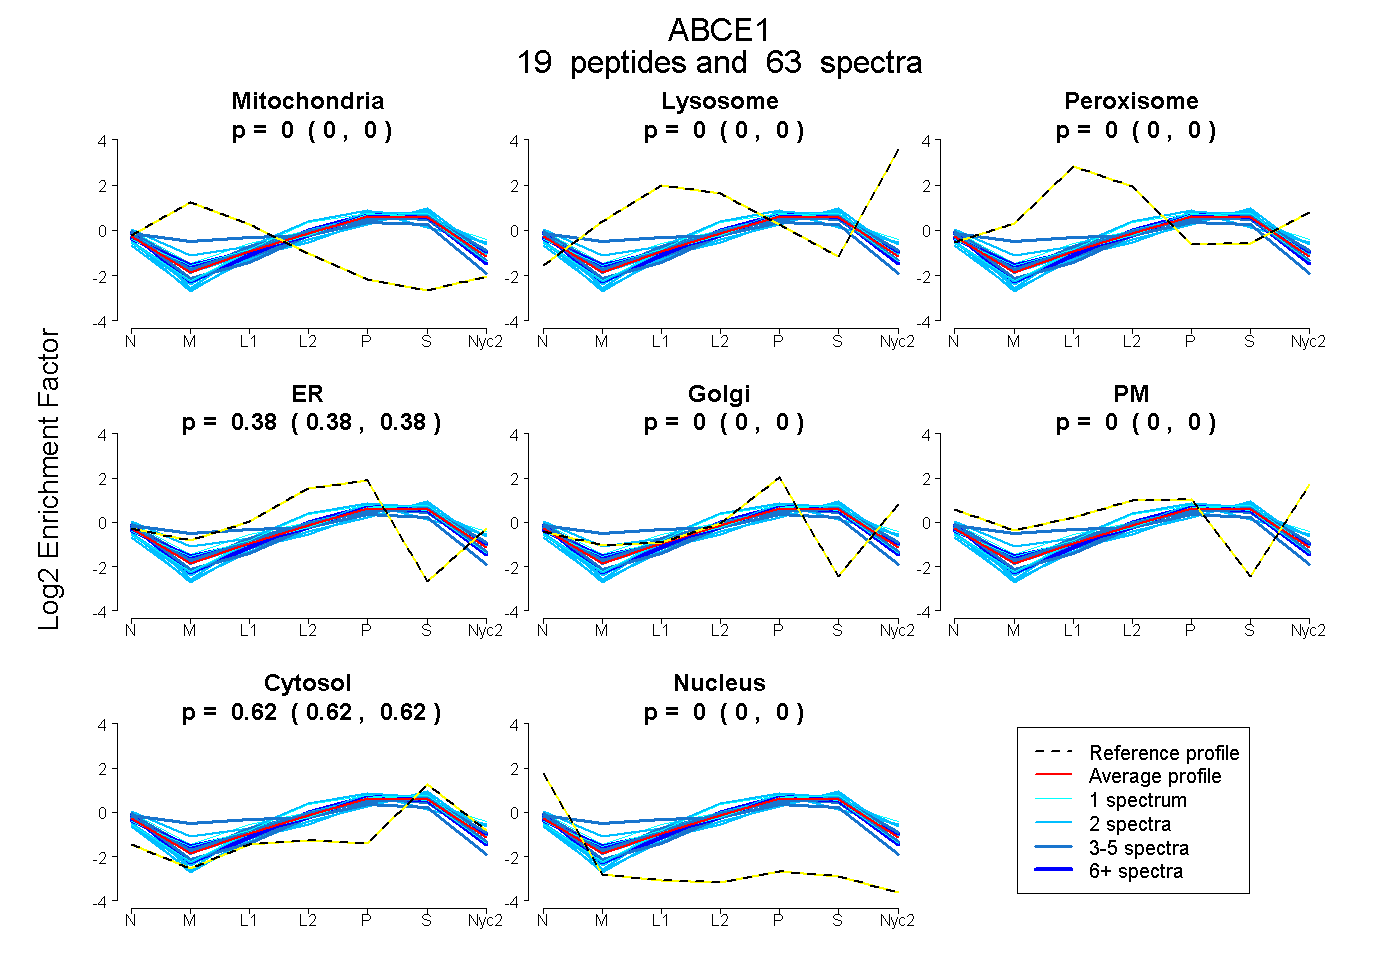
0.000 | 0.000
0.000 | 0.000
0.000 | 0.000
0.380 | 0.384
0.000 | 0.000
0.000 | 0.000
0.616 | 0.620
0.000 | 0.000
11peptides
spectra
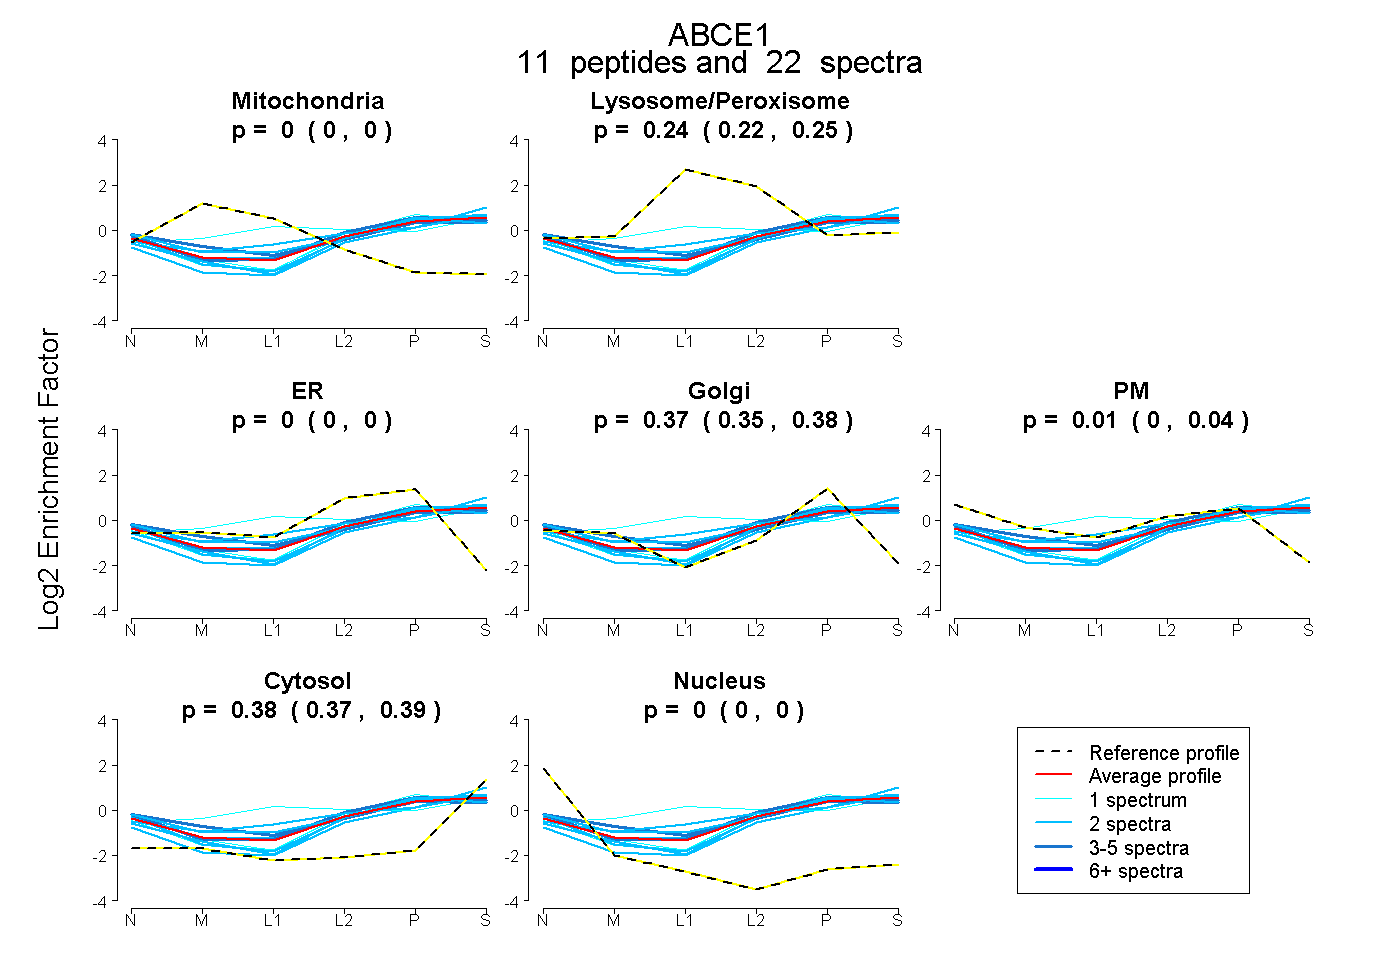
0.000 | 0.000
0.220 | 0.247
0.000 | 0.000
0.351 | 0.382
0.000 | 0.035
0.374 | 0.386
0.000 | 0.000
25peptides
spectra
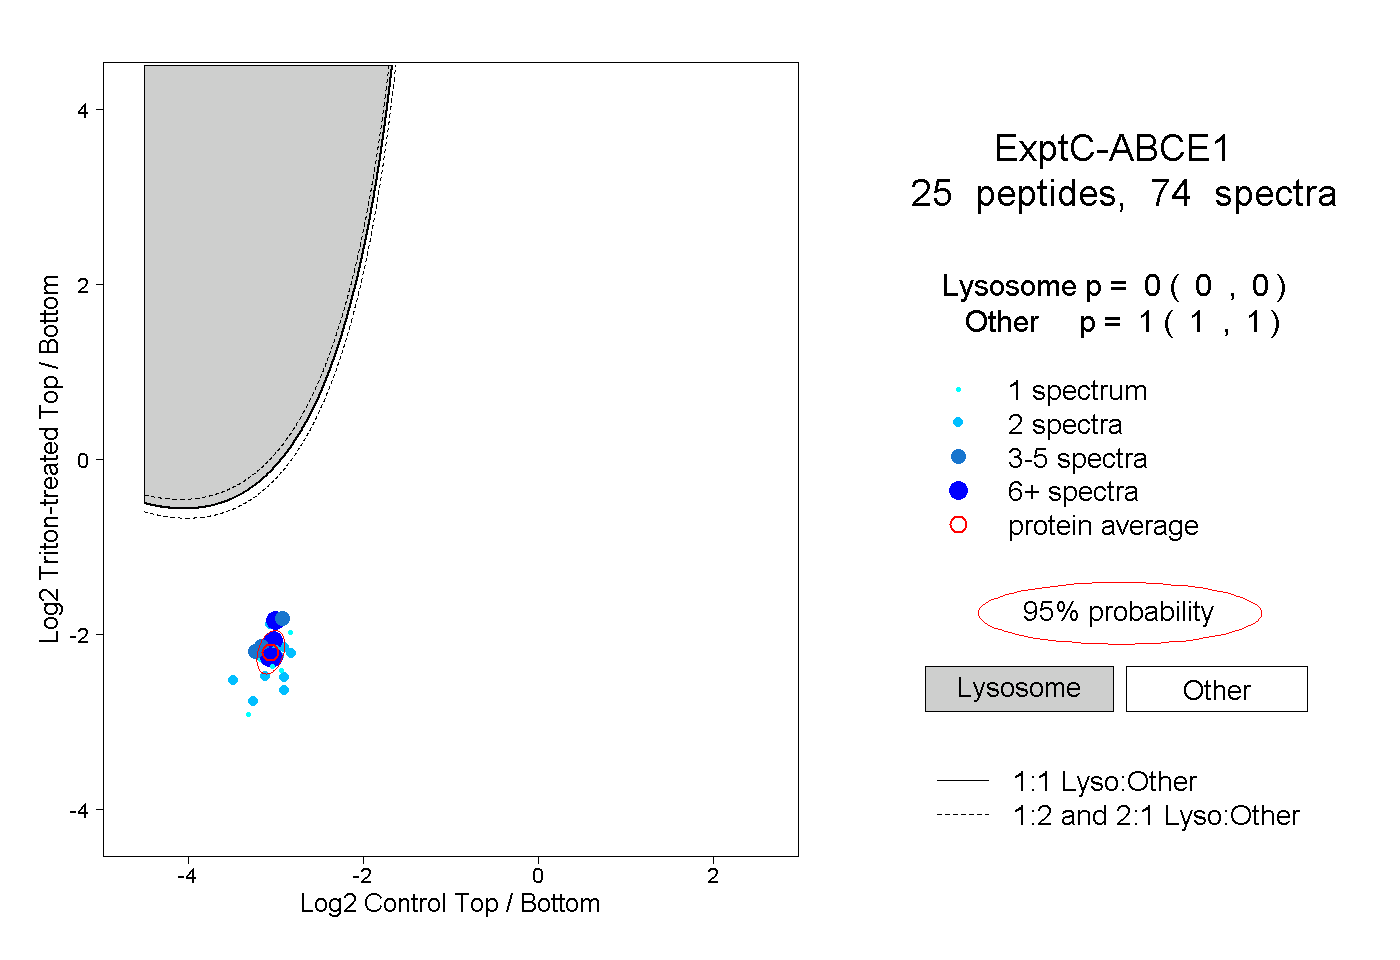
0.000 | 0.000
1.000 | 1.000
11peptides
spectra
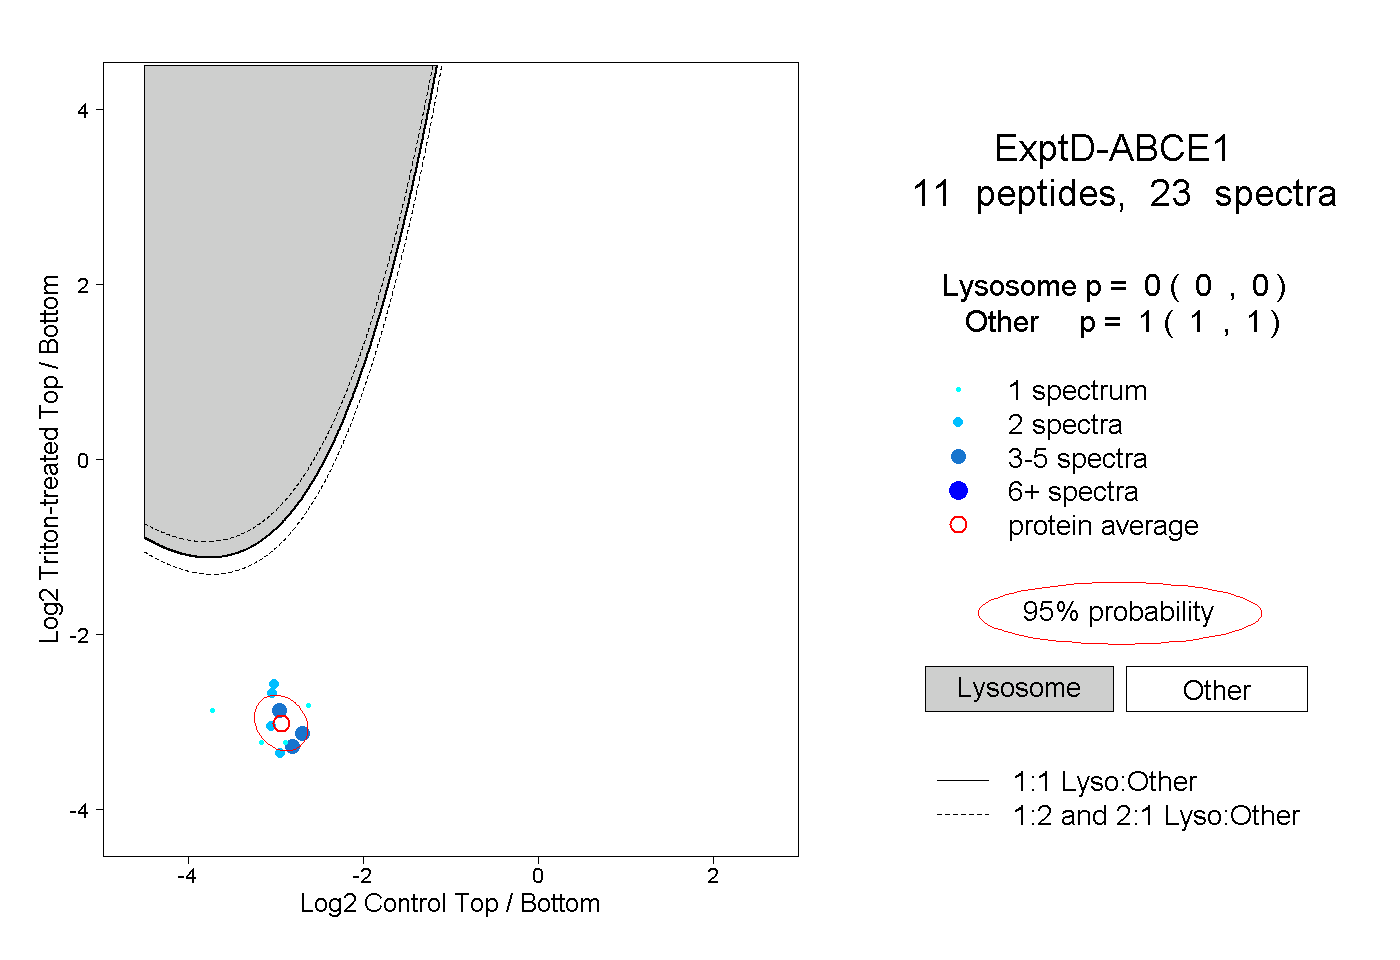
0.000 | 0.000
1.000 | 1.000