 44
44peptides
spectra
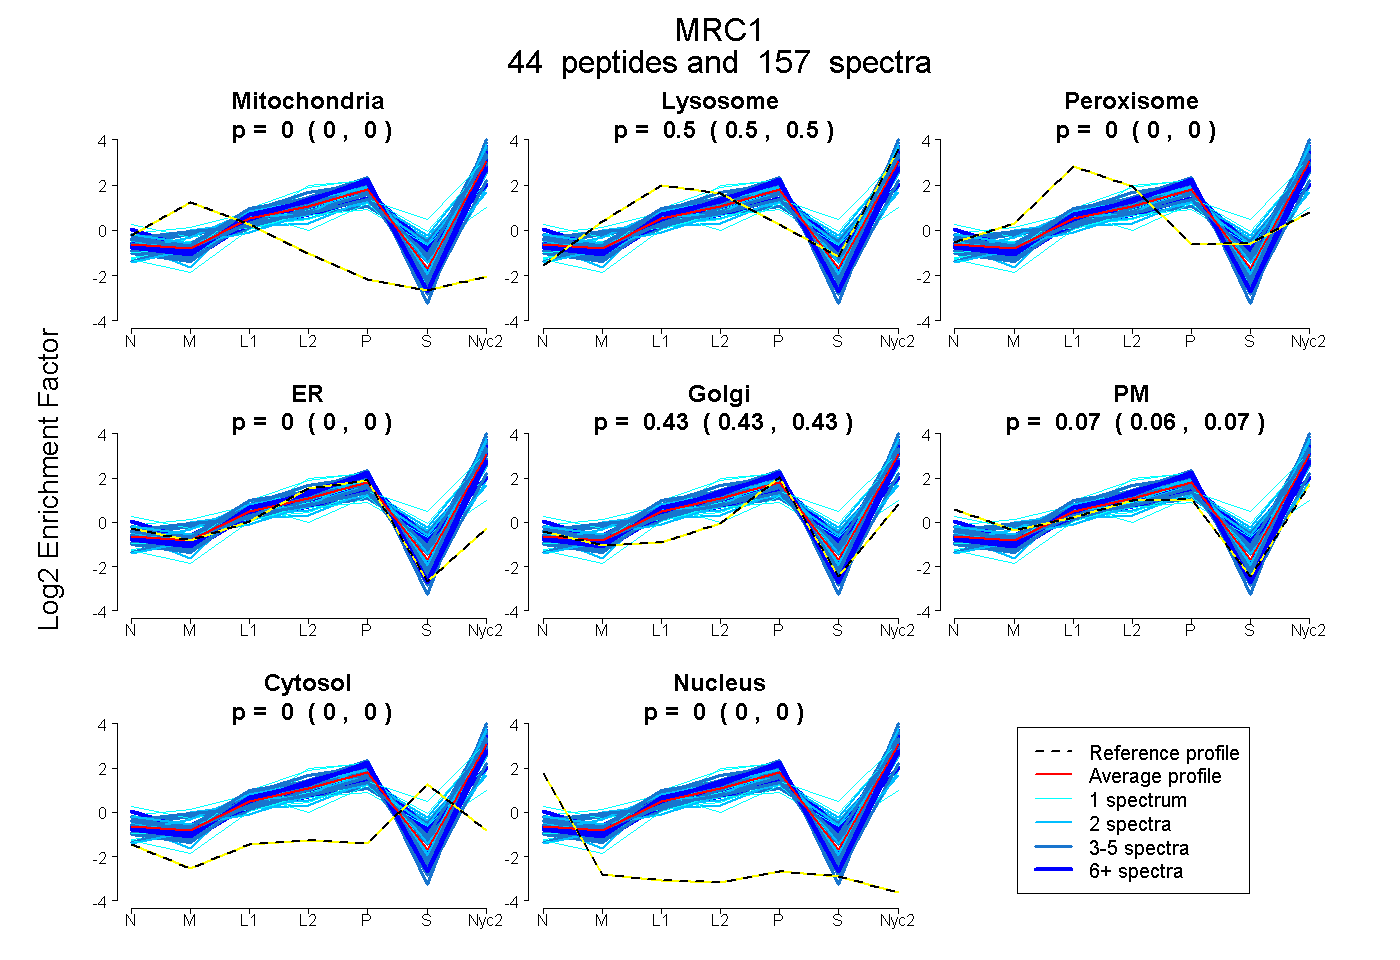
0.000 | 0.000
0.498 | 0.504
0.000 | 0.000
0.000 | 0.000
0.426 | 0.433
0.063 | 0.074
0.000 | 0.000
0.000 | 0.000
9peptides
spectra
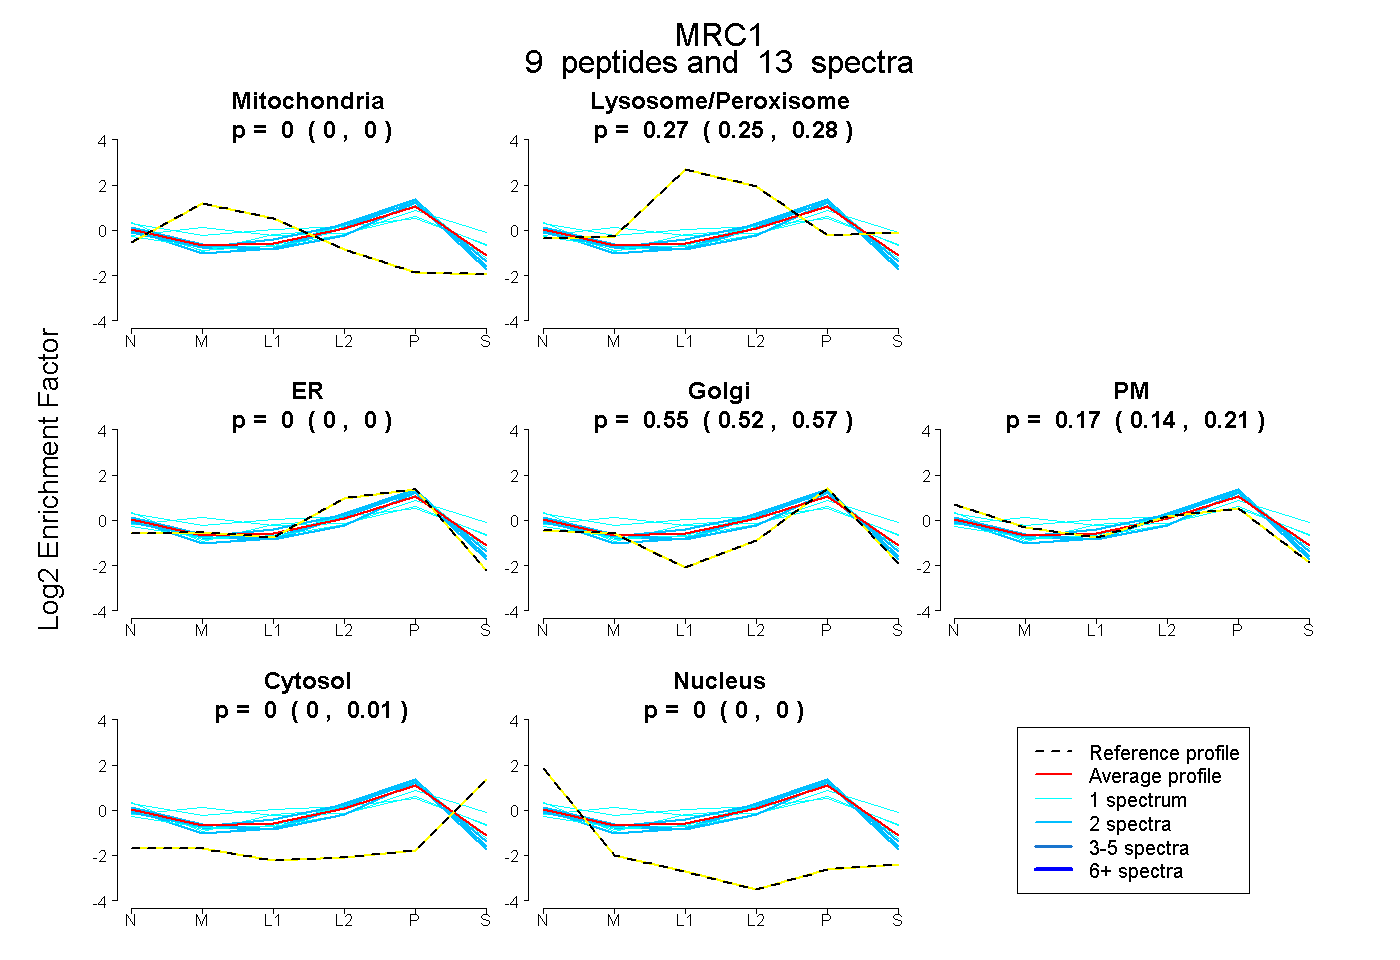
0.000 | 0.000
0.251 | 0.284
0.000 | 0.000
0.520 | 0.572
0.141 | 0.207
0.000 | 0.015
0.000 | 0.000
45peptides
spectra
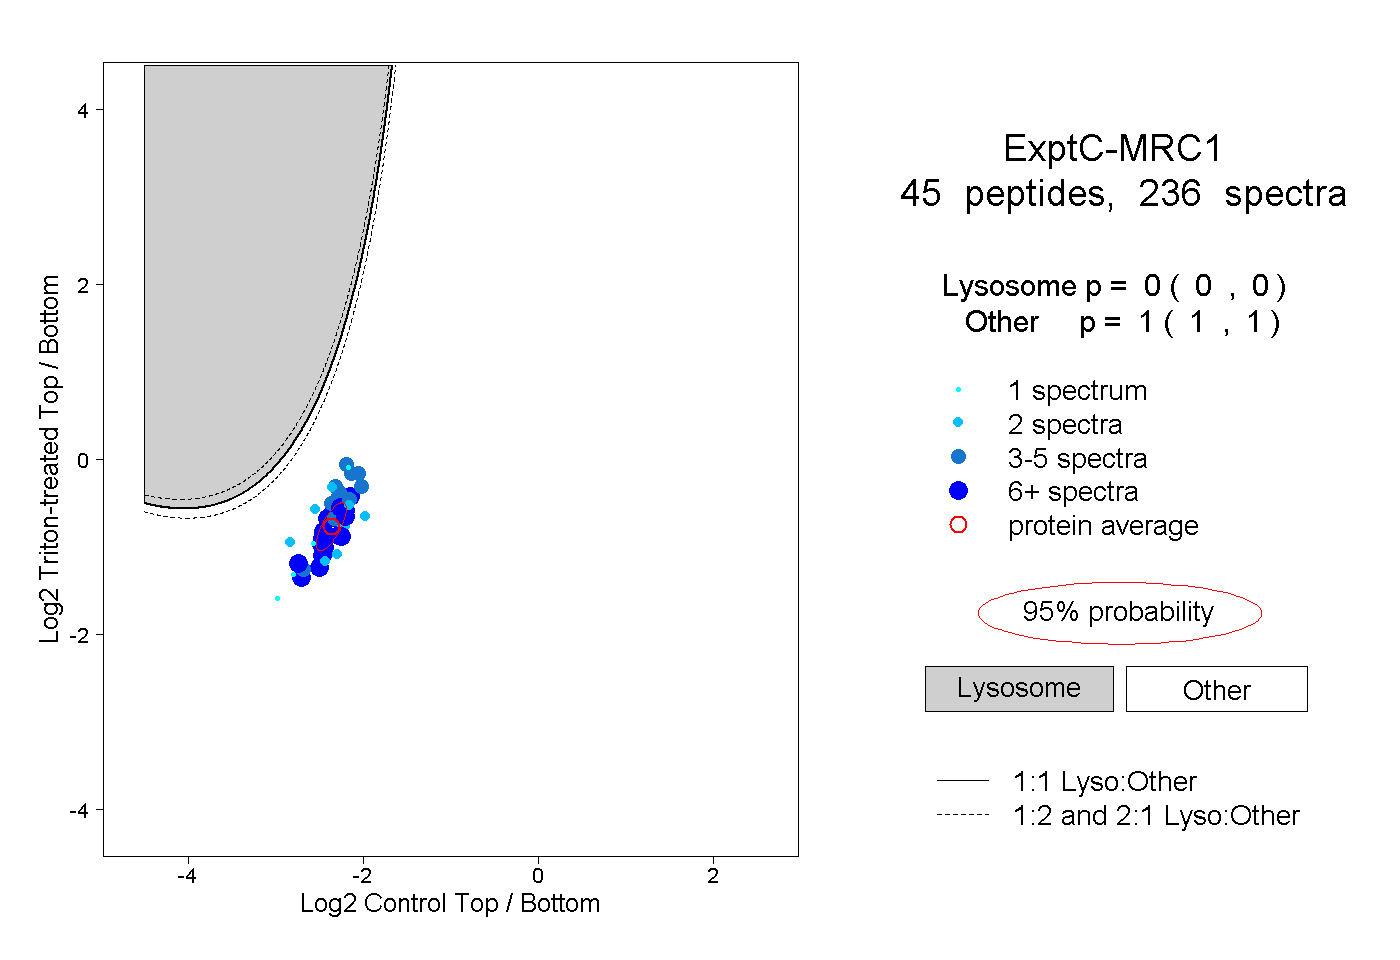
0.000 | 0.000
1.000 | 1.000
18peptides
spectra
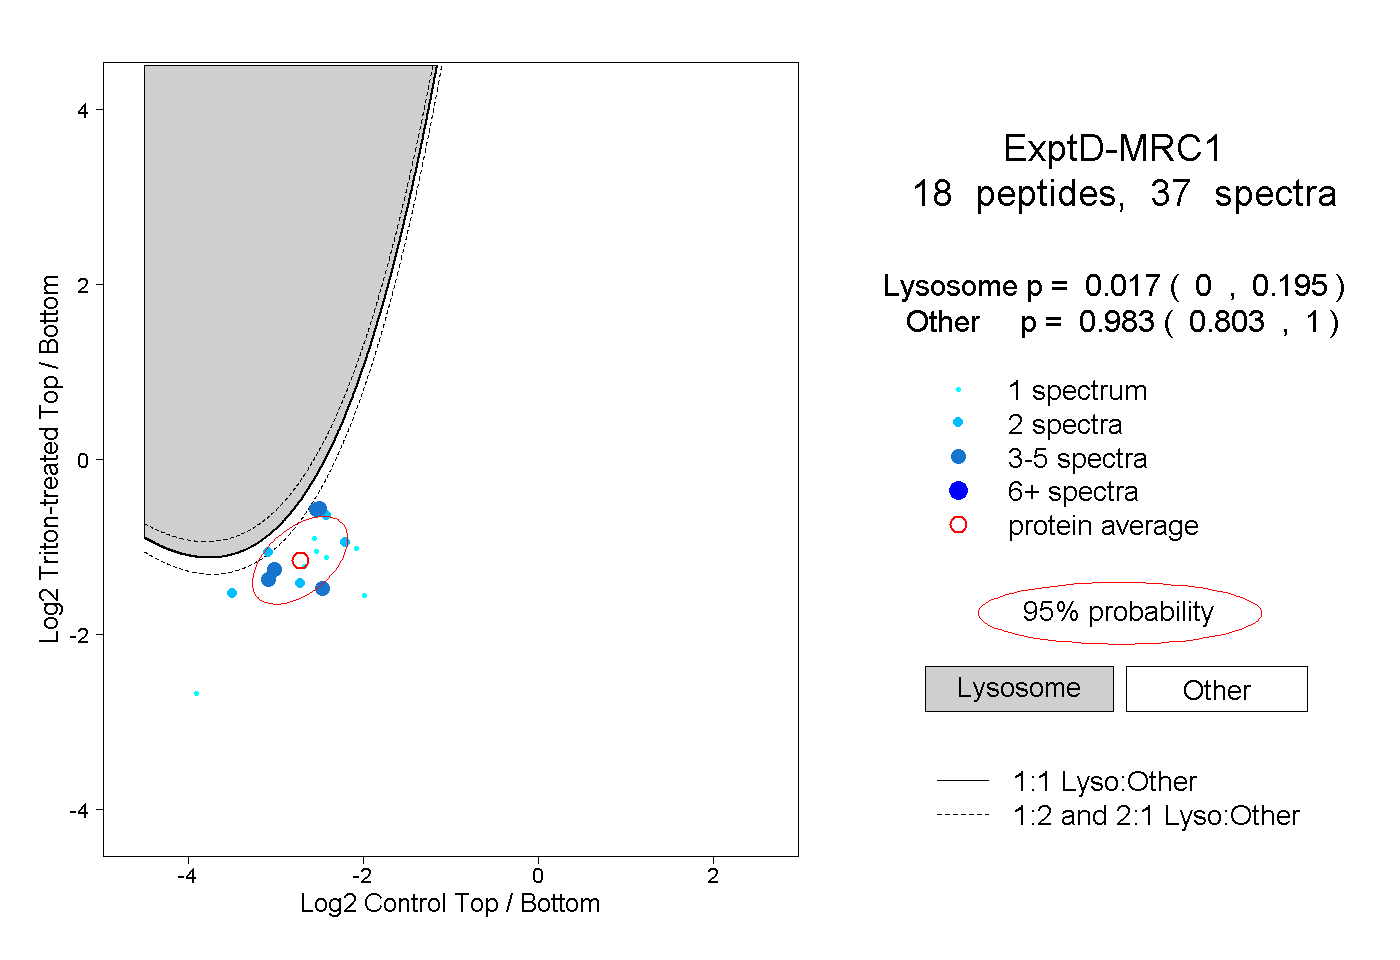
0.000 | 0.195
0.803 | 1.000