MRC1
[ENSRNOP00000024736]
Main page
| | | Plot |
Mito |
Lyso |
|
Perox |
ER |
Golgi |
PM |
Cytosol |
Nucleus |
|
| Expt A |
 44
44
peptides |
157
spectra |
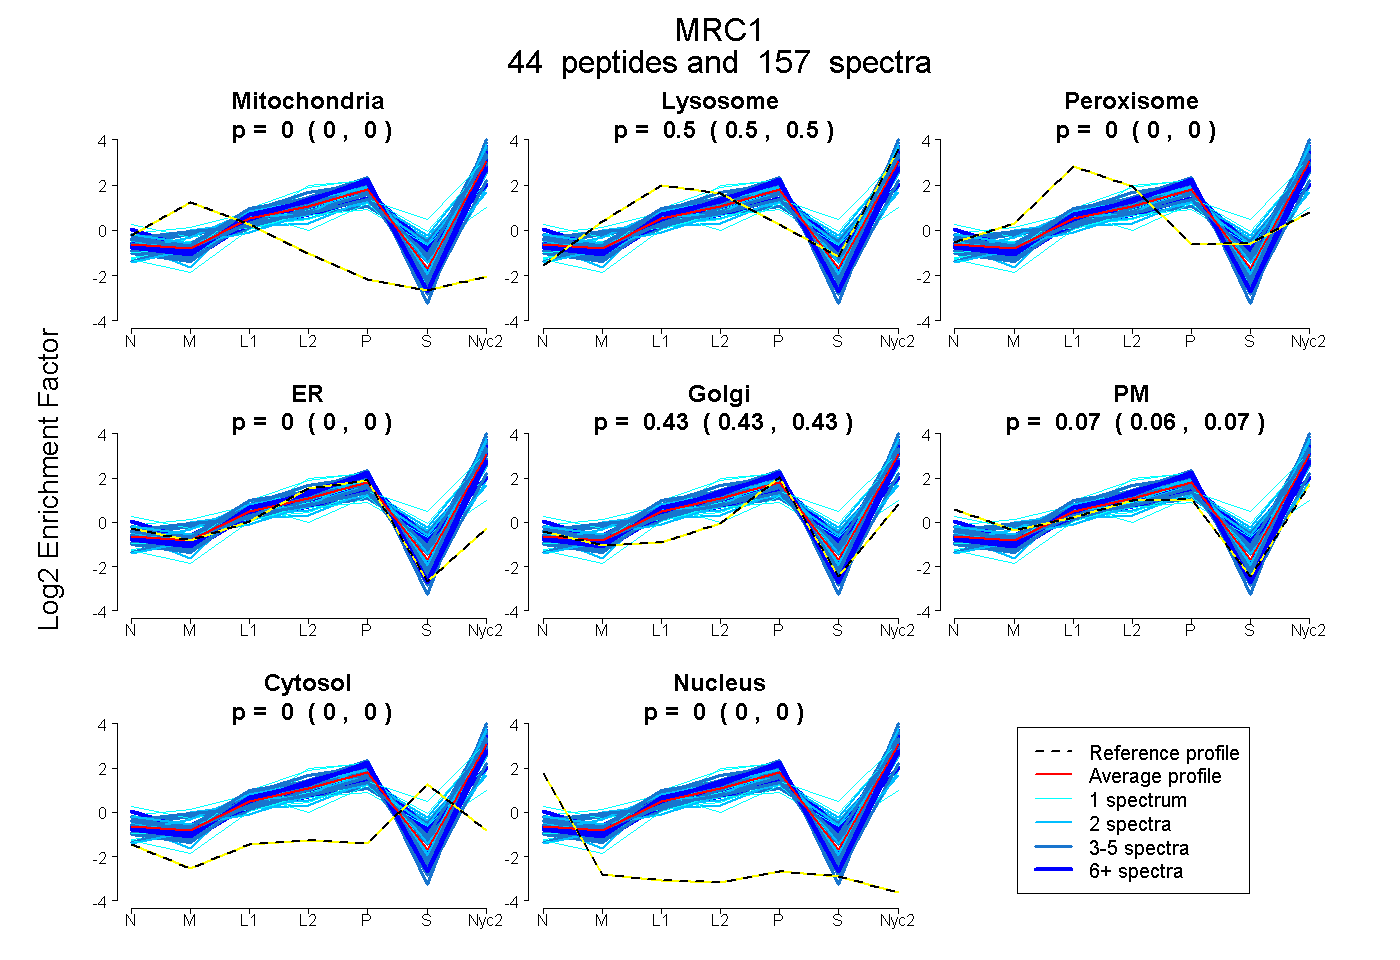 |
0.000
0.000 | 0.000 |
0.501
0.498 | 0.504 |
|
0.000
0.000 | 0.000 |
0.000
0.000 | 0.000 |
0.430
0.426 | 0.433 |
0.069
0.063 | 0.074 |
0.000
0.000 | 0.000 |
0.000
0.000 | 0.000 |
|
| | | Plot |
Mito |
|
Lyso or Perox |
|
ER |
Golgi |
PM |
Cytosol |
Nucleus |
|
| Expt B |
9
peptides |
13
spectra |
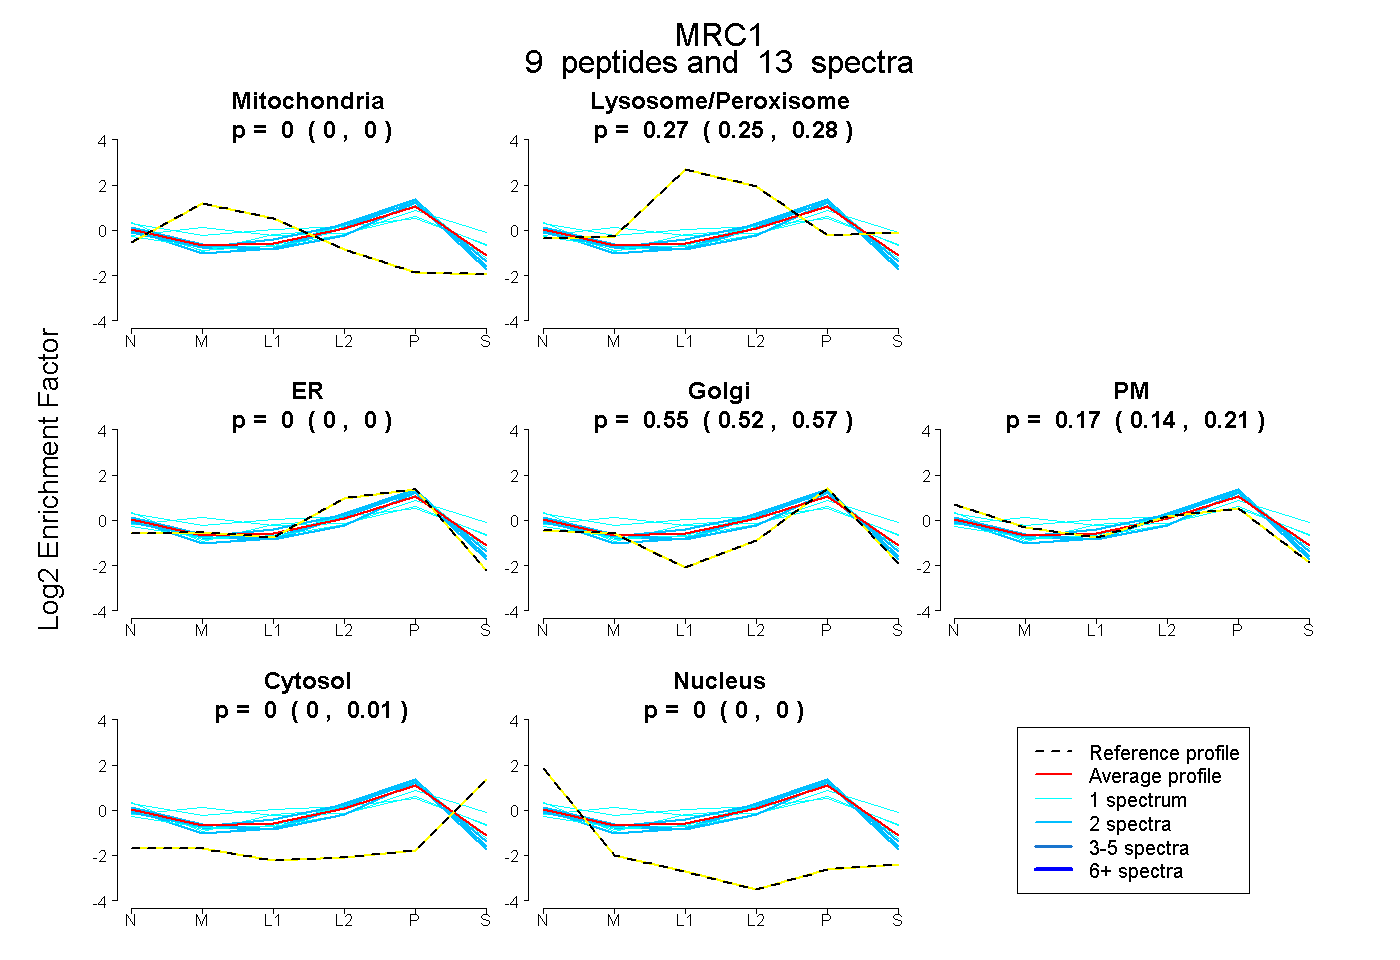 |
0.000
0.000 | 0.000 |
|
0.271
0.251 | 0.284 |
|
0.000
0.000 | 0.000 |
0.554
0.520 | 0.572 |
0.173
0.141 | 0.207 |
0.002
0.000 | 0.015 |
0.000
0.000 | 0.000 |
|
| 1 spectrum, IFGFAEEEK |
0.000 |
|
0.312 |
|
0.000 |
0.505 |
0.000 |
0.182 |
0.000 |
|
| 2 spectra, AIGGELASIK |
0.000 |
|
0.115 |
|
0.322 |
0.353 |
0.210 |
0.000 |
0.000 |
|
| 2 spectra, VYGTTDDLCSR |
0.000 |
|
0.106 |
|
0.057 |
0.473 |
0.363 |
0.000 |
0.000 |
|
| 1 spectrum, TWFESR |
0.000 |
|
0.233 |
|
0.097 |
0.525 |
0.145 |
0.000 |
0.000 |
|
| 1 spectrum, EGWHLYNNK |
0.000 |
|
0.313 |
|
0.000 |
0.146 |
0.452 |
0.089 |
0.000 |
|
| 2 spectra, YALQACR |
0.000 |
|
0.252 |
|
0.175 |
0.457 |
0.116 |
0.000 |
0.000 |
|
| 2 spectra, GSGLWSR |
0.000 |
|
0.189 |
|
0.141 |
0.526 |
0.145 |
0.000 |
0.000 |
|
| 1 spectrum, SCVSLNPGK |
0.000 |
|
0.289 |
|
0.000 |
0.421 |
0.279 |
0.000 |
0.011 |
|
| 1 spectrum, LCLGVPSK |
0.089 |
|
0.333 |
|
0.000 |
0.468 |
0.051 |
0.059 |
0.000 |
|
| | | Plot |
|
Lyso |
|
|
|
|
|
|
|
Other |
| Expt C |
45
peptides |
236
spectra |
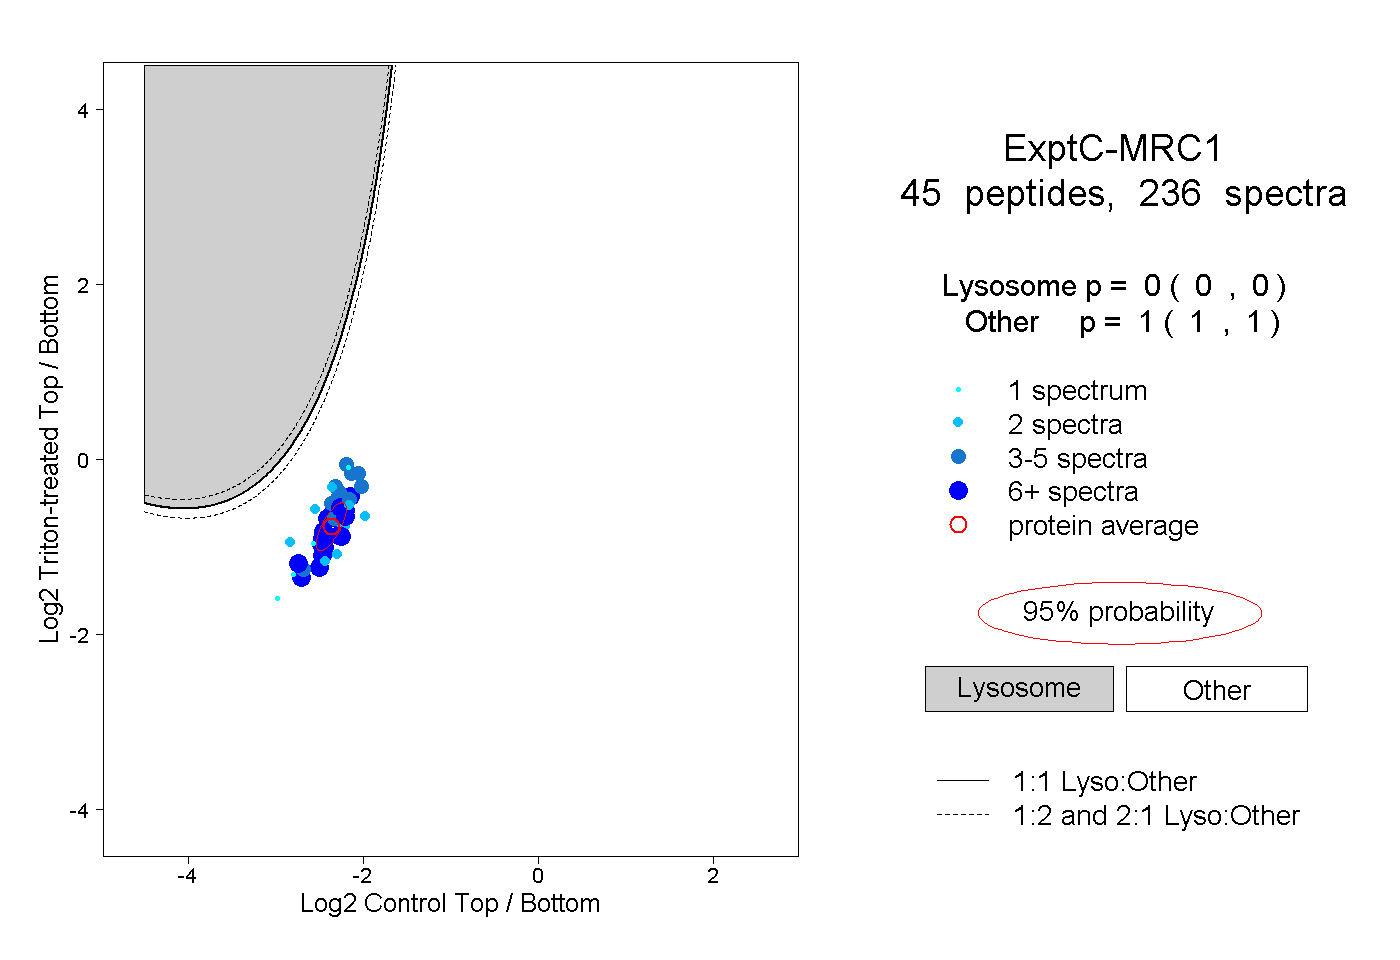 |
|
0.000
0.000 | 0.000 |
|
|
|
|
|
|
|
1.000
1.000 | 1.000 |
| | | Plot |
|
Lyso |
|
|
|
|
|
|
|
Other |
| Expt D |
18
peptides |
37
spectra |
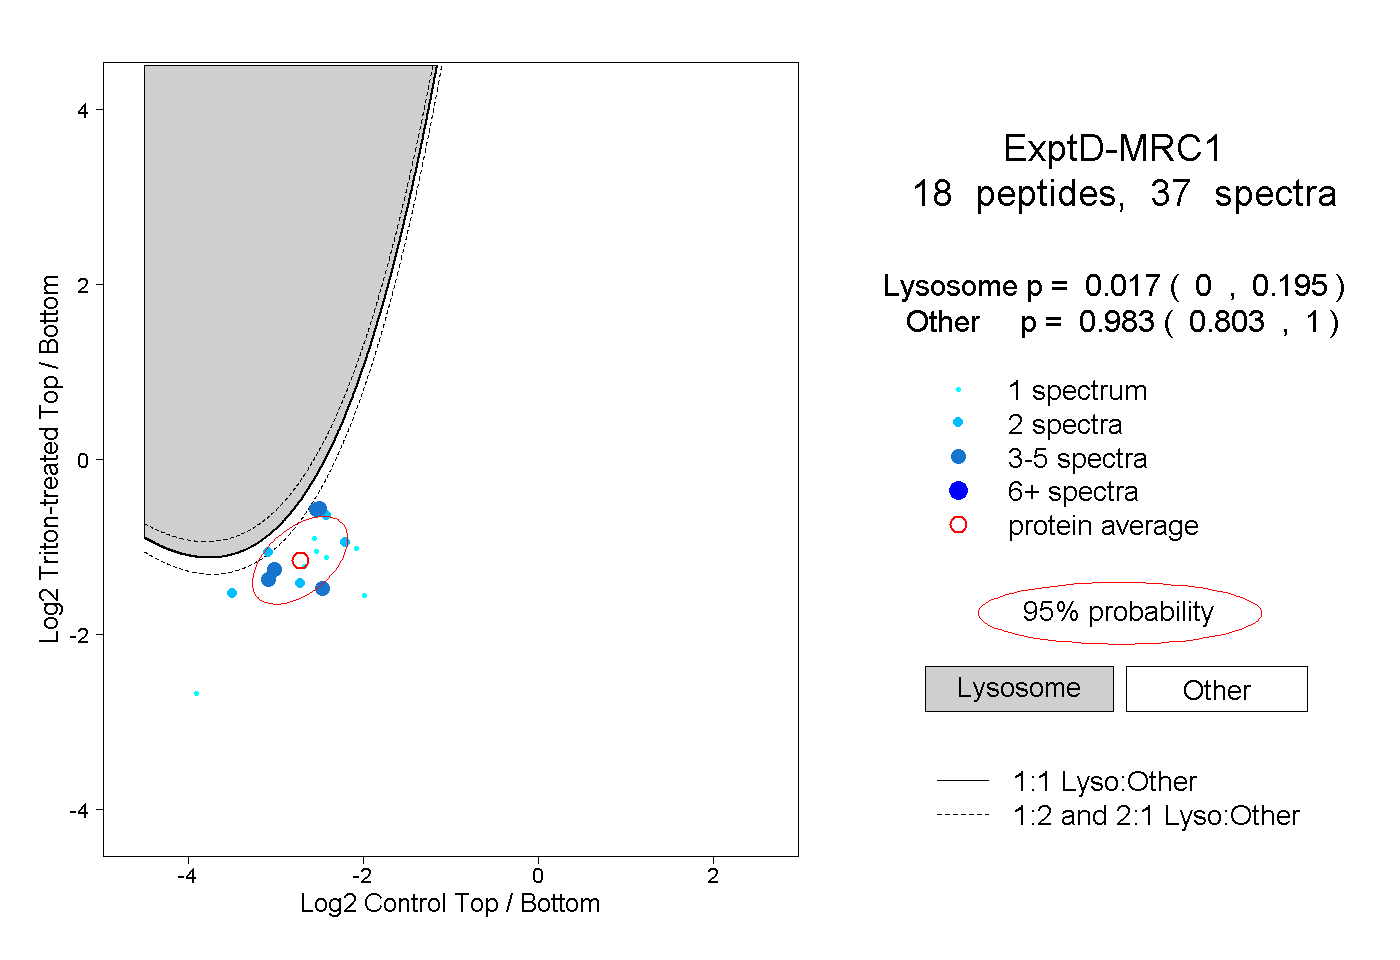 |
|
0.017
0.000 | 0.195 |
|
|
|
|
|
|
|
0.983
0.803 | 1.000 |