 9
9peptides
spectra
0.142 | 0.147
0.000 | 0.000
0.000 | 0.000
0.000 | 0.000
0.000 | 0.000
0.000 | 0.000
0.852 | 0.858
0.000 | 0.000
| Plot | Mito | Lyso | Perox | ER | Golgi | PM | Cytosol | Nucleus | |||||
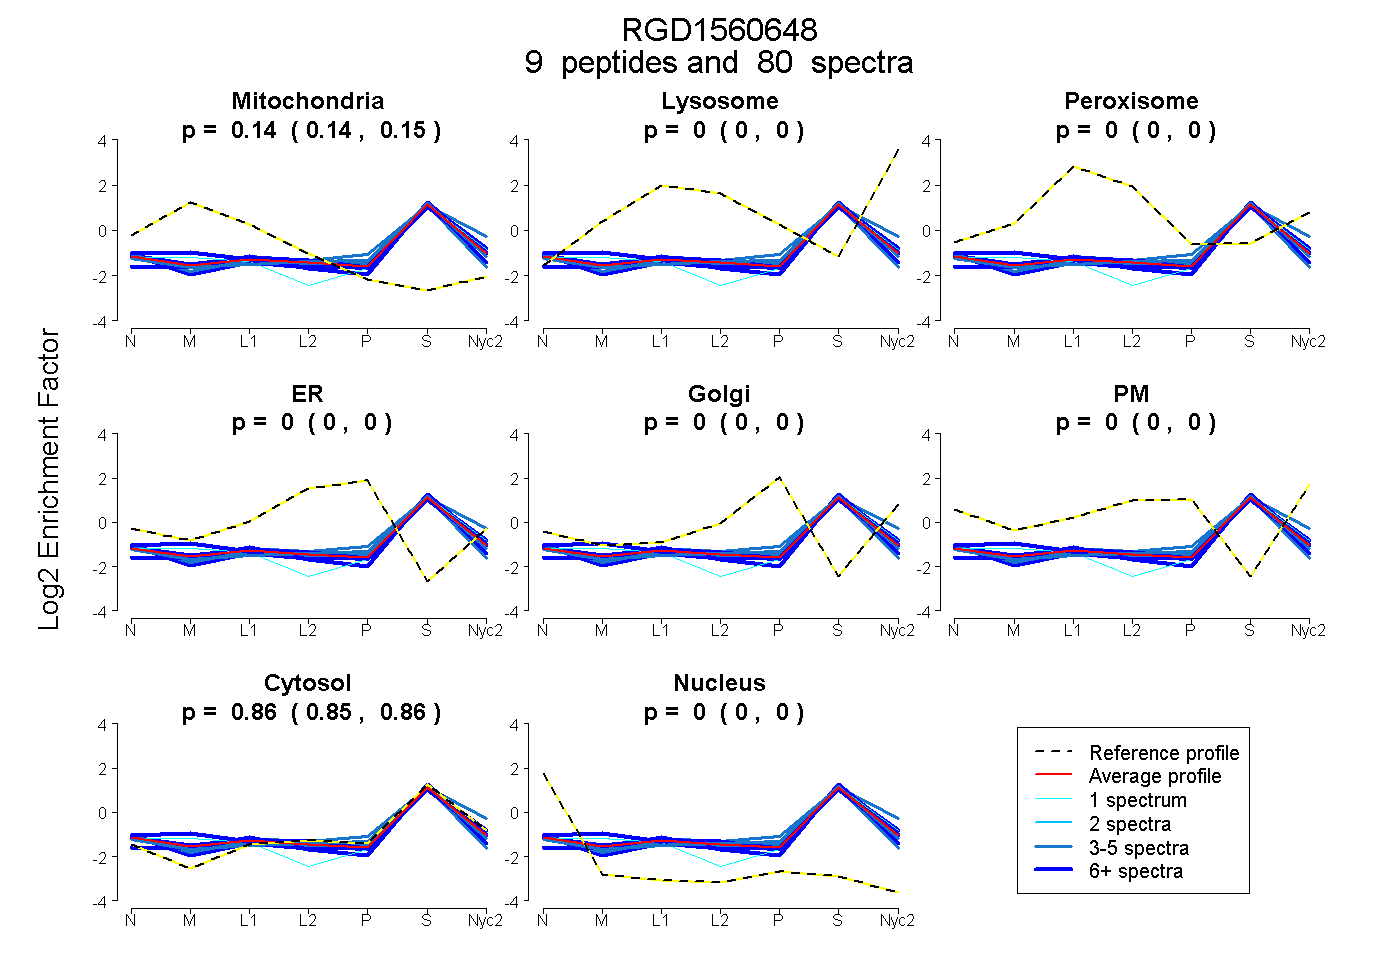
| Expt A |
9 peptides |
80 spectra |
|
0.145 0.142 | 0.147 |
0.000 0.000 | 0.000 |
0.000 0.000 | 0.000 |
0.000 0.000 | 0.000 |
0.000 0.000 | 0.000 |
0.000 0.000 | 0.000 |
0.855 0.852 | 0.858 |
0.000 0.000 | 0.000 |
| 15 spectra, ALVILAK | 0.134 | 0.000 | 0.000 | 0.000 | 0.000 | 0.000 | 0.866 | 0.000 | ||
| 4 spectra, VTVAGLAGK | 0.112 | 0.000 | 0.000 | 0.000 | 0.000 | 0.000 | 0.888 | 0.000 | ||
| 19 spectra, VTSHPLAK | 0.219 | 0.000 | 0.000 | 0.000 | 0.000 | 0.000 | 0.781 | 0.000 | ||
| 7 spectra, GAEEMETVIPVDIMR | 0.119 | 0.000 | 0.000 | 0.000 | 0.000 | 0.000 | 0.881 | 0.000 | ||
| 1 spectrum, GPGTSFEFALAIVEALSGK | 0.162 | 0.000 | 0.000 | 0.000 | 0.000 | 0.000 | 0.838 | 0.000 | ||
| 20 spectra, DMANQVK | 0.135 | 0.012 | 0.007 | 0.000 | 0.000 | 0.000 | 0.846 | 0.000 | ||
| 6 spectra, DPVQCSR | 0.076 | 0.000 | 0.000 | 0.000 | 0.000 | 0.000 | 0.871 | 0.053 | ||
| 3 spectra, DGLILTSR | 0.052 | 0.094 | 0.000 | 0.000 | 0.008 | 0.003 | 0.843 | 0.000 | ||
| 5 spectra, DVVICPDTSLEEAK | 0.112 | 0.000 | 0.000 | 0.000 | 0.000 | 0.000 | 0.845 | 0.043 |
| Plot | Mito | Lyso or Perox | ER | Golgi | PM | Cytosol | Nucleus | ||||||
| Expt B |
4 peptides |
15 spectra |
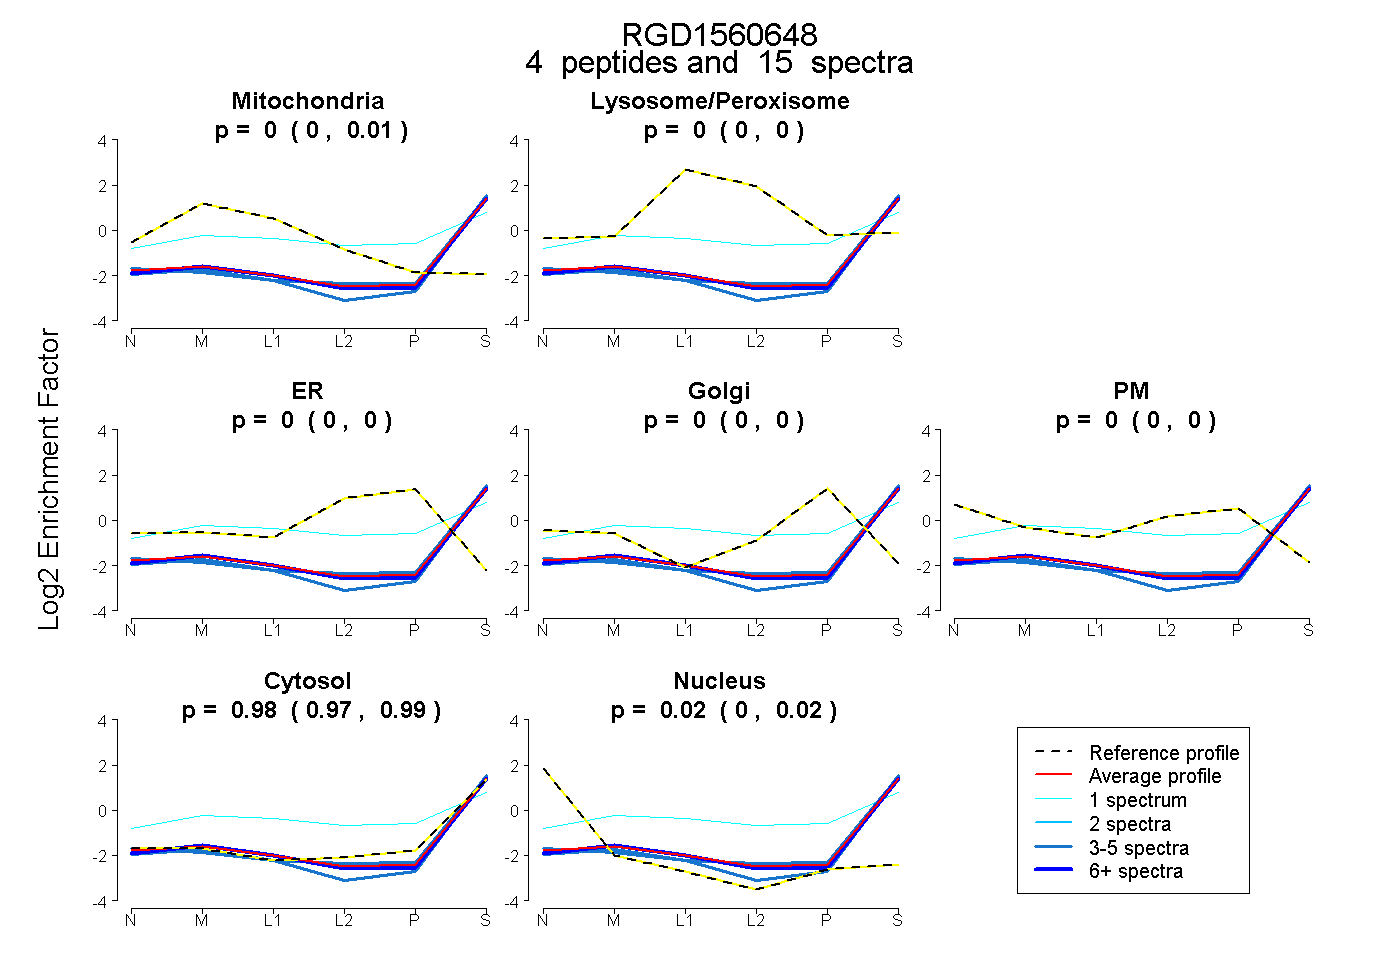 |
0.000 0.000 | 0.014 |
0.000 0.000 | 0.000 |
0.000 0.000 | 0.000 |
0.000 0.000 | 0.000 |
0.000 0.000 | 0.000 |
0.985 0.972 | 0.993 |
0.015 0.000 | 0.025 |
|||
| Plot | Lyso | Other | |||||||||||
| Expt C |
10 peptides |
96 spectra |
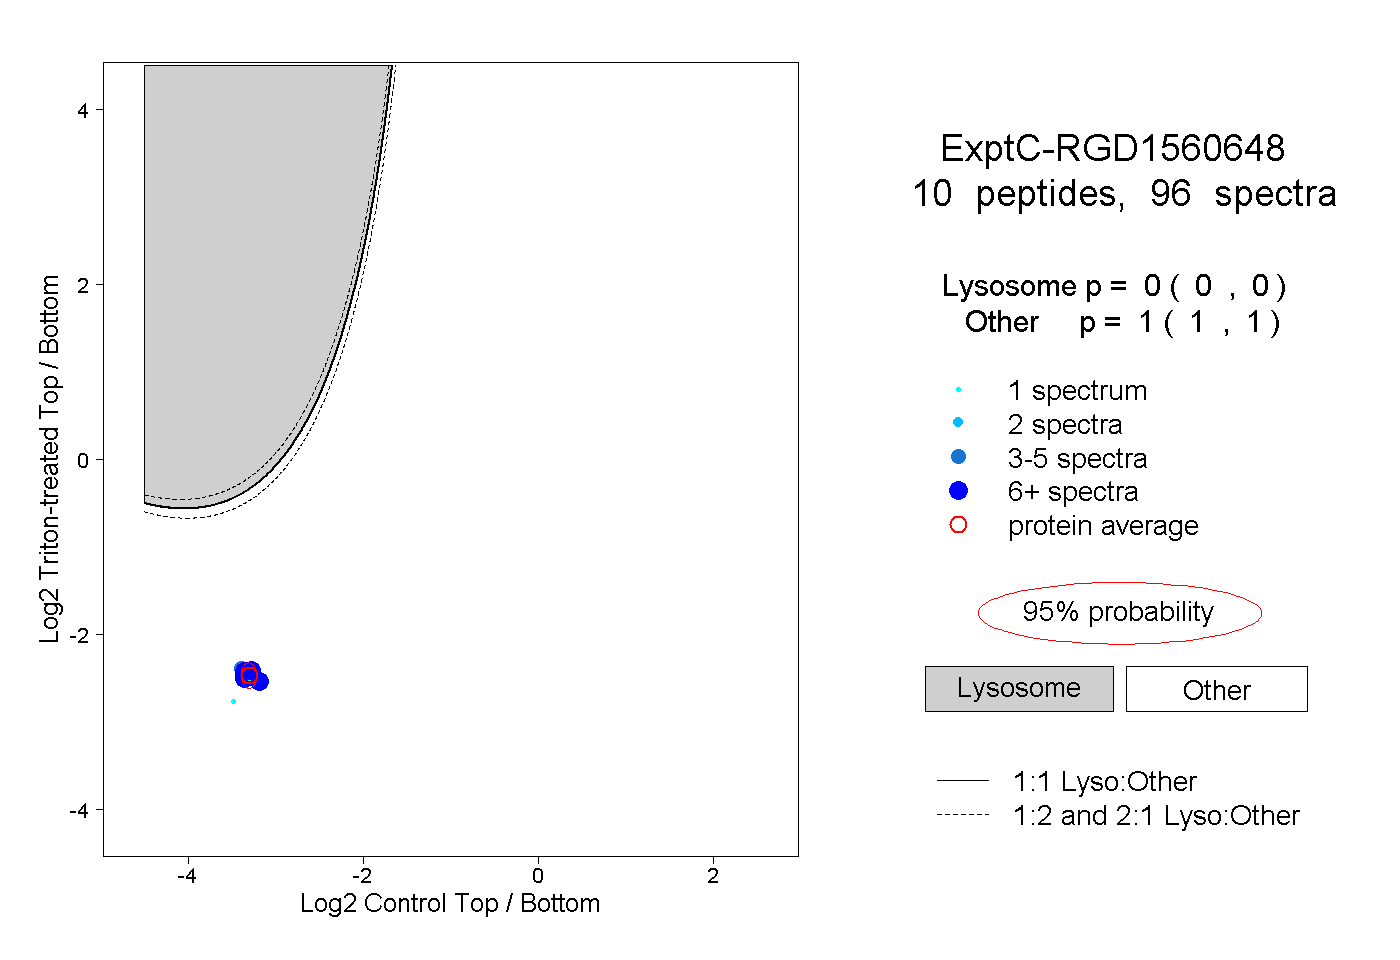 |
0.000 0.000 | 0.000 |
1.000 1.000 | 1.000 |
||||||||
| Plot | Lyso | Other | |||||||||||
| Expt D |
5 peptides |
13 spectra |
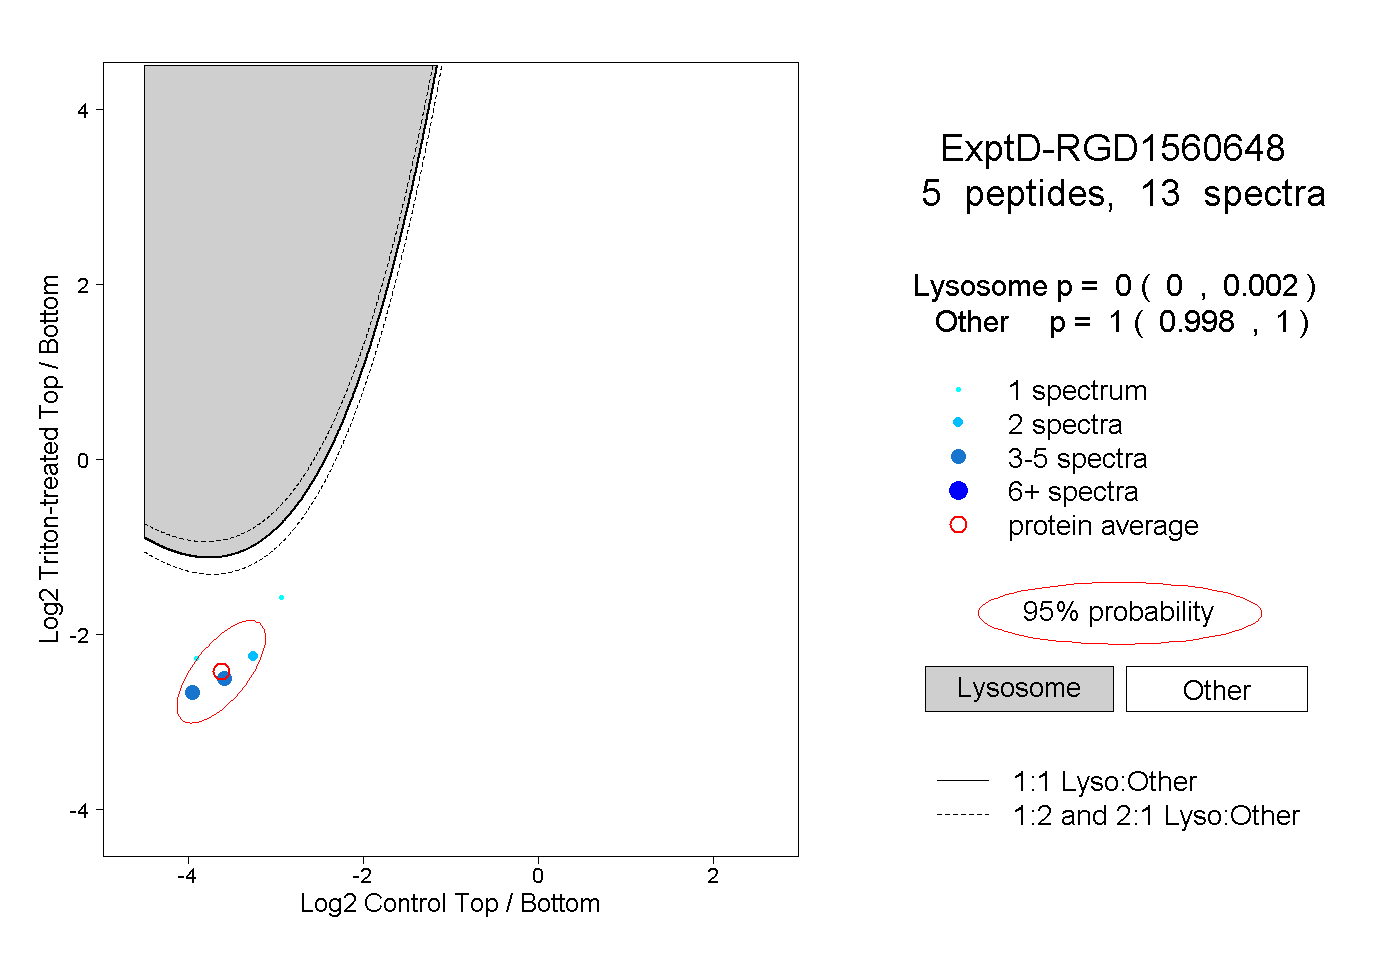 |
0.000 0.000 | 0.002 |
1.000 0.998 | 1.000 |