HPX
[ENSRNOP00000024710]
Main page
| | | Plot |
Mito |
Lyso |
|
Perox |
ER |
Golgi |
PM |
Cytosol |
Nucleus |
|
| Expt A |
 22
22
peptides |
153
spectra |
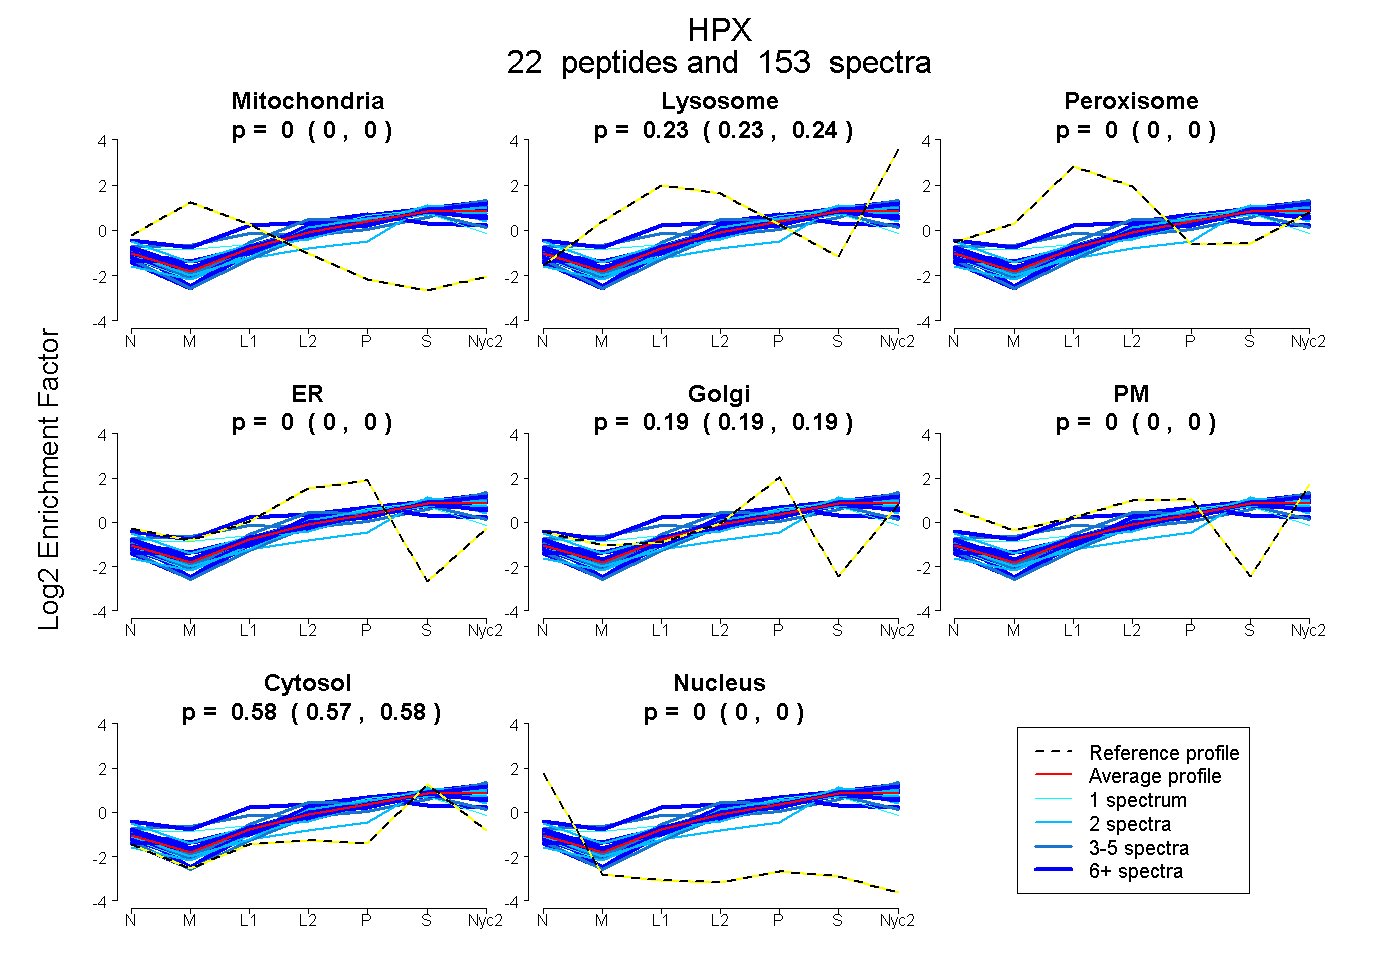 |
0.000
0.000 | 0.000 |
0.234
0.232 | 0.236 |
|
0.000
0.000 | 0.000 |
0.000
0.000 | 0.000 |
0.191
0.189 | 0.192 |
0.000
0.000 | 0.000 |
0.575
0.574 | 0.577 |
0.000
0.000 | 0.000 |
|
| | | Plot |
Mito |
|
Lyso or Perox |
|
ER |
Golgi |
PM |
Cytosol |
Nucleus |
|
| Expt B |
13
peptides |
57
spectra |
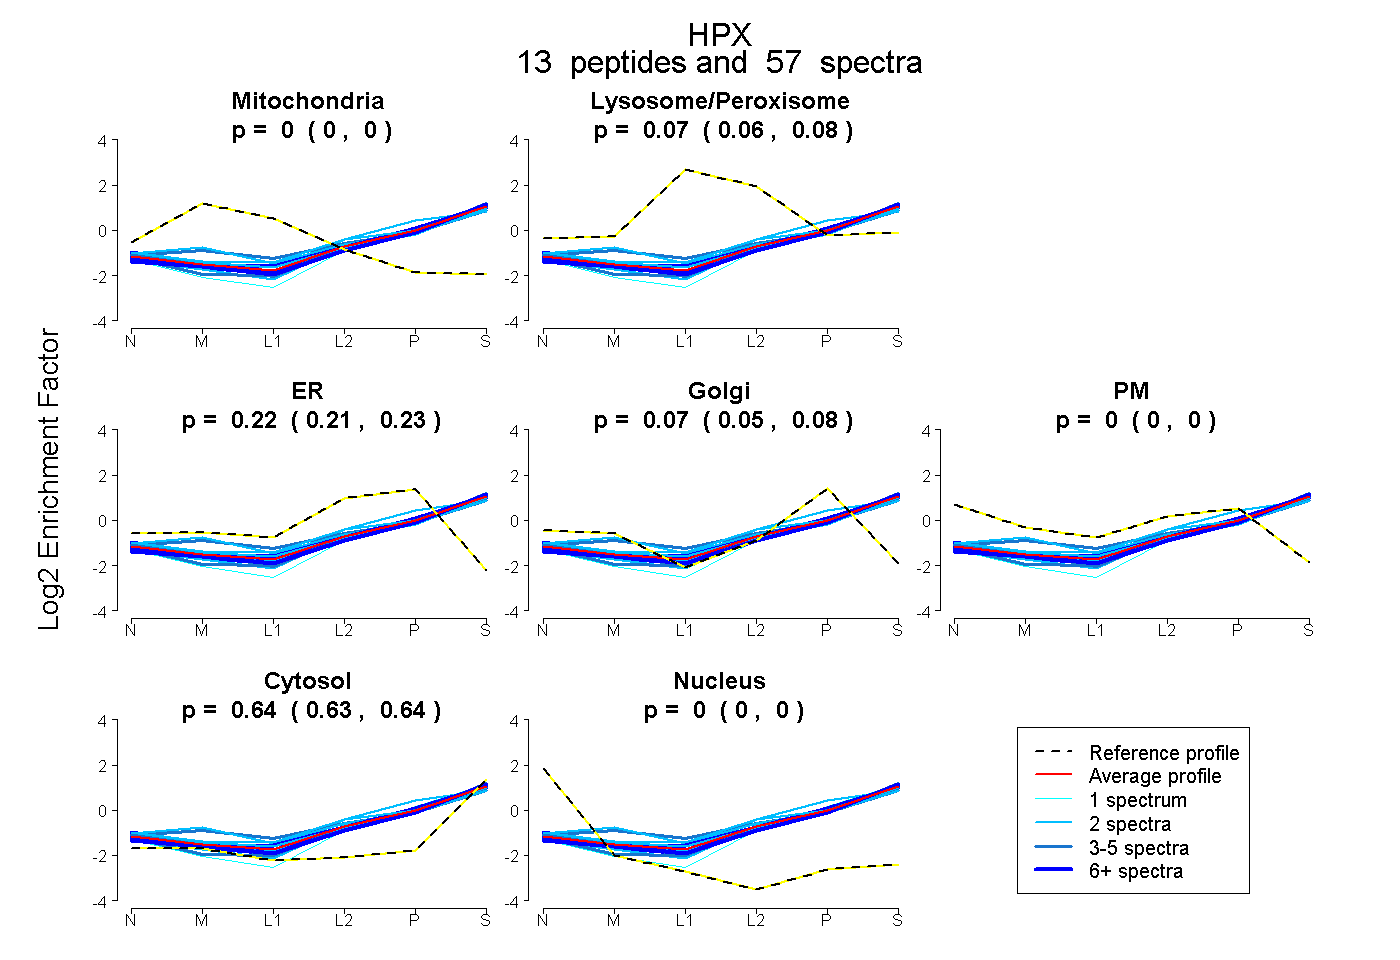 |
0.000
0.000 | 0.000 |
|
0.071
0.063 | 0.077 |
|
0.222
0.206 | 0.235 |
0.068
0.055 | 0.079 |
0.000
0.000 | 0.000 |
0.639
0.635 | 0.644 |
0.000
0.000 | 0.000 |
|
| 2 spectra, GPDSVFLIK |
0.000 |
|
0.000 |
|
0.296 |
0.000 |
0.000 |
0.704 |
0.000 |
|
| 5 spectra, FNPVTGEVPPR |
0.000 |
|
0.239 |
|
0.000 |
0.239 |
0.000 |
0.521 |
0.000 |
|
| 1 spectrum, GGNNLVSGYPK |
0.000 |
|
0.000 |
|
0.149 |
0.167 |
0.000 |
0.684 |
0.000 |
|
| 6 spectra, DYFISCPGR |
0.000 |
|
0.082 |
|
0.147 |
0.151 |
0.000 |
0.621 |
0.000 |
|
| 14 spectra, LYVTSGR |
0.000 |
|
0.104 |
|
0.172 |
0.099 |
0.000 |
0.625 |
0.000 |
|
| 2 spectra, ENGYPK |
0.000 |
|
0.015 |
|
0.403 |
0.005 |
0.000 |
0.577 |
0.000 |
|
| 2 spectra, VDGALCLEK |
0.000 |
|
0.150 |
|
0.062 |
0.176 |
0.000 |
0.612 |
0.000 |
|
| 2 spectra, SLPQPQK |
0.000 |
|
0.146 |
|
0.226 |
0.046 |
0.000 |
0.581 |
0.000 |
|
| 2 spectra, GHSGIR |
0.000 |
|
0.207 |
|
0.000 |
0.271 |
0.000 |
0.522 |
0.000 |
|
| 7 spectra, GEFVWR |
0.000 |
|
0.031 |
|
0.244 |
0.057 |
0.000 |
0.667 |
0.000 |
|
| 6 spectra, WFWDFATR |
0.000 |
|
0.014 |
|
0.276 |
0.000 |
0.000 |
0.710 |
0.000 |
|
| 4 spectra, LWWLDLK |
0.000 |
|
0.007 |
|
0.279 |
0.000 |
0.000 |
0.713 |
0.000 |
|
| 4 spectra, NPVTSVDAAFR |
0.000 |
|
0.017 |
|
0.267 |
0.064 |
0.000 |
0.651 |
0.000 |
|
| | | Plot |
|
Lyso |
|
|
|
|
|
|
|
Other |
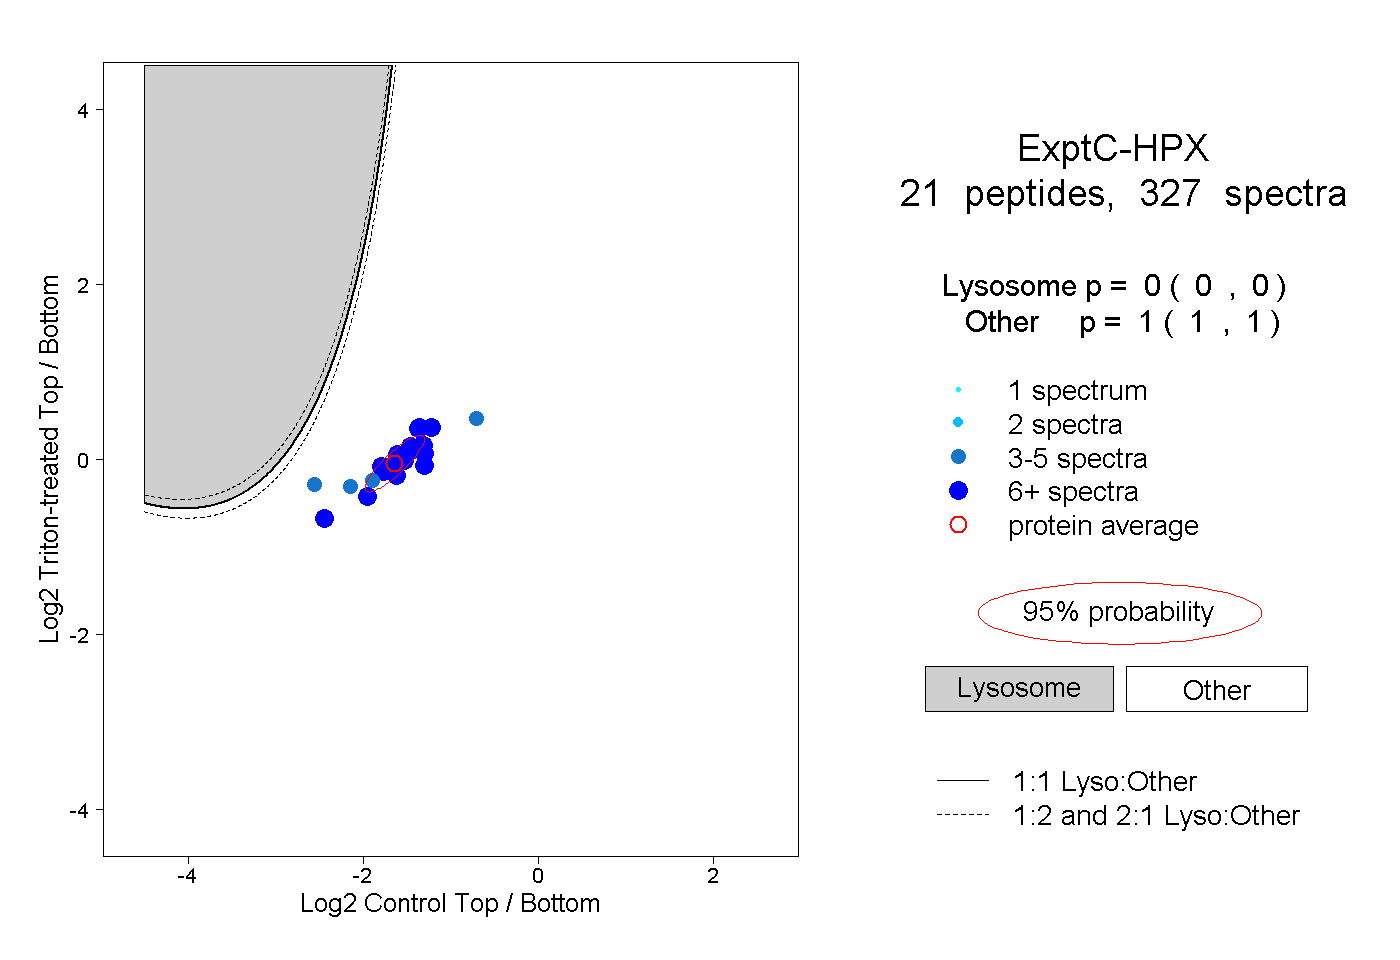
| Expt C |
21
peptides |
327
spectra |
 |
|
0.000
0.000 | 0.000 |
|
|
|
|
|
|
|
1.000
1.000 | 1.000 |
| | | Plot |
|
Lyso |
|
|
|
|
|
|
|
Other |
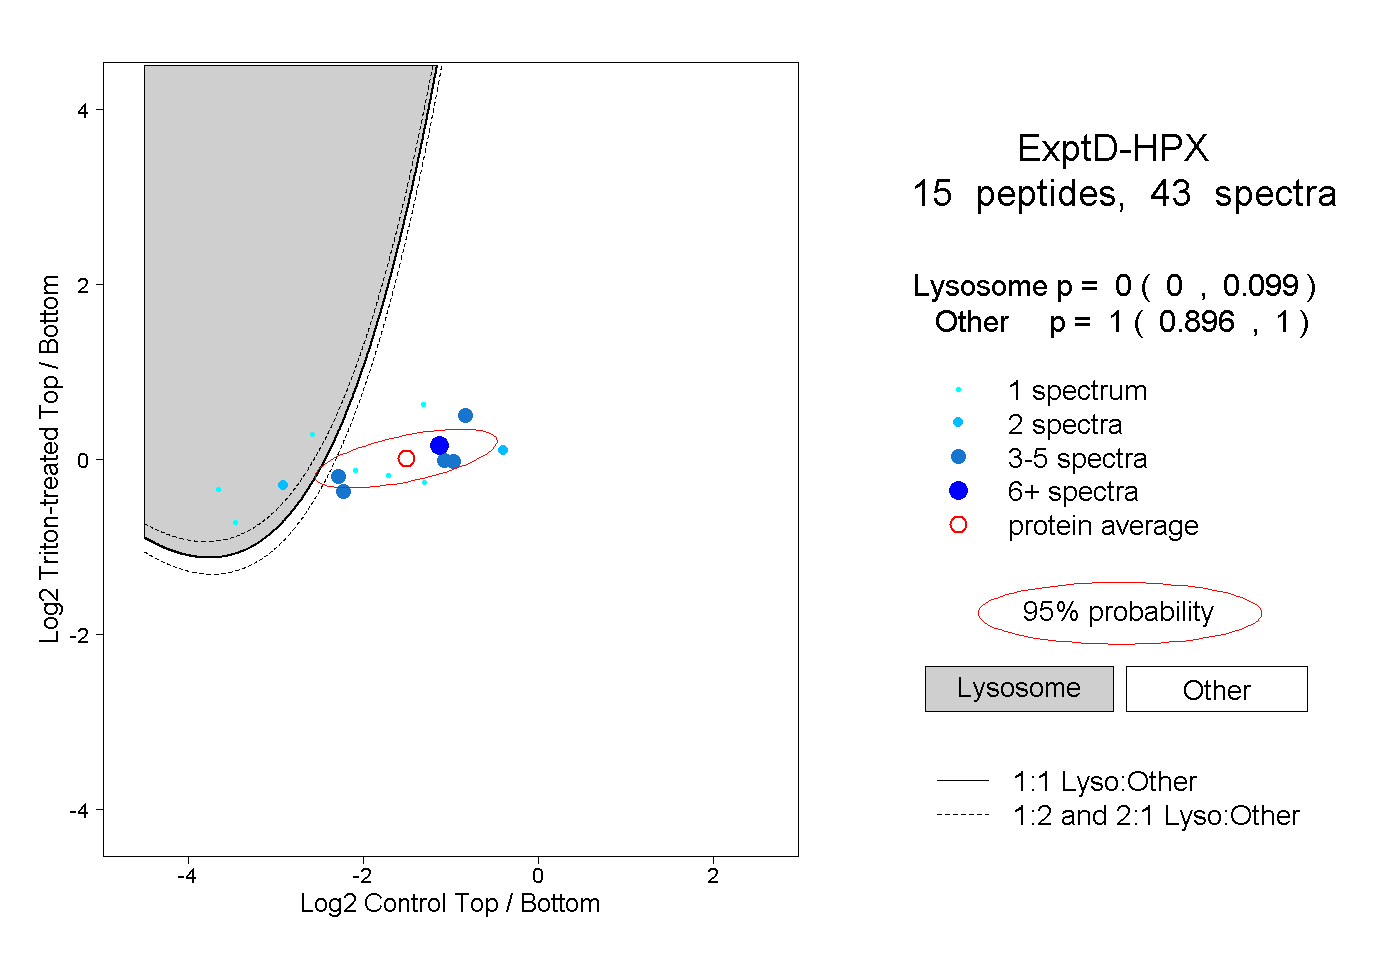
| Expt D |
15
peptides |
43
spectra |
 |
|
0.000
0.000 | 0.099 |
|
|
|
|
|
|
|
1.000
0.896 | 1.000 |