 22
22peptides
spectra
0.000 | 0.000
0.232 | 0.236
0.000 | 0.000
0.000 | 0.000
0.189 | 0.192
0.000 | 0.000
0.574 | 0.577
0.000 | 0.000
| Plot | Mito | Lyso | Perox | ER | Golgi | PM | Cytosol | Nucleus | |||||
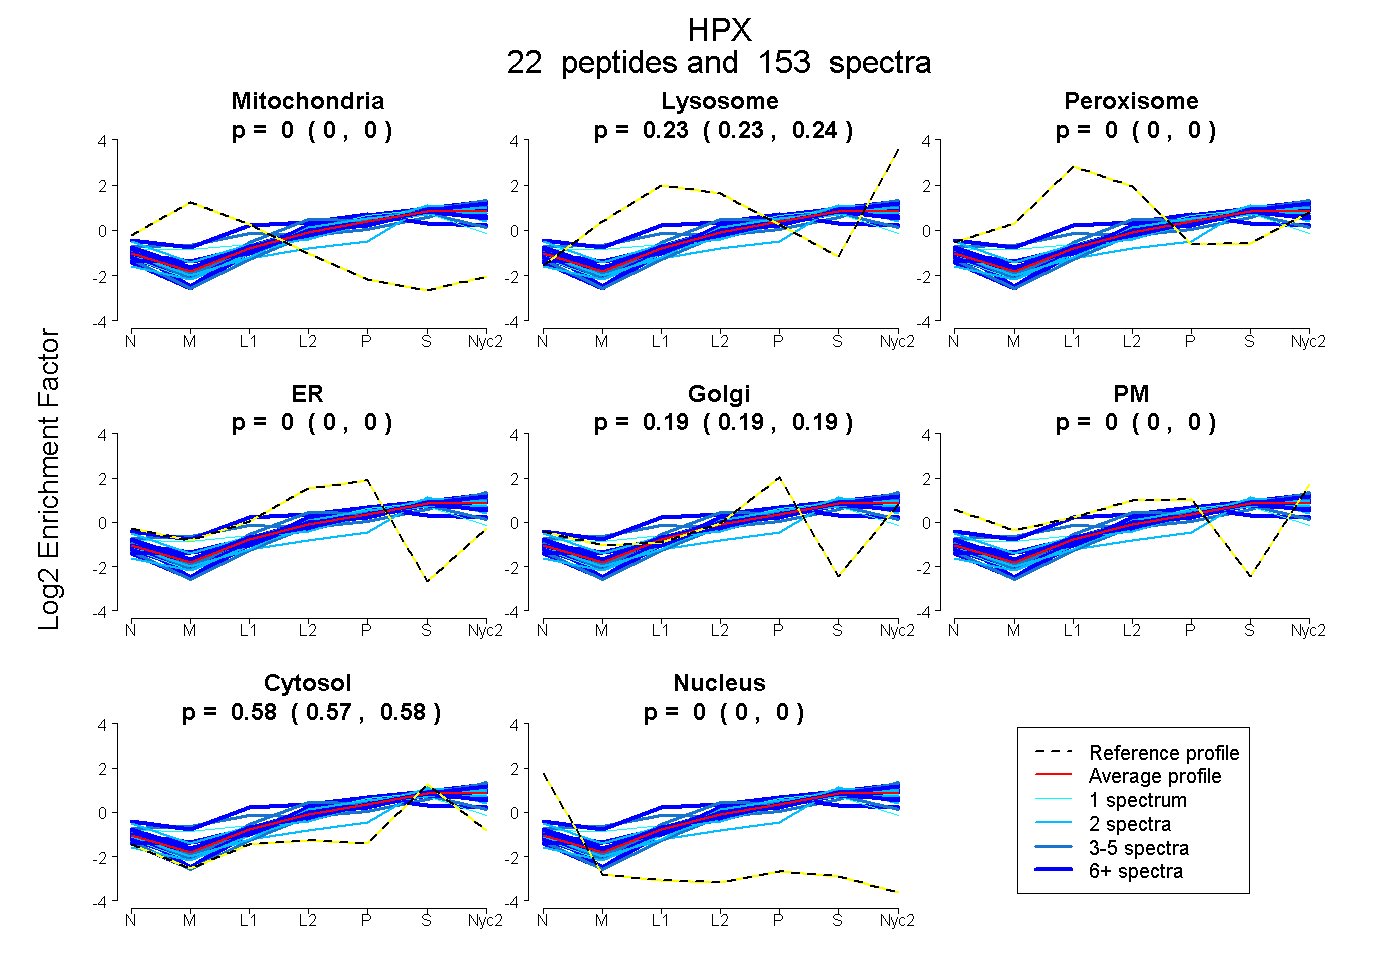
| Expt A |
22 peptides |
153 spectra |
|
0.000 0.000 | 0.000 |
0.234 0.232 | 0.236 |
0.000 0.000 | 0.000 |
0.000 0.000 | 0.000 |
0.191 0.189 | 0.192 |
0.000 0.000 | 0.000 |
0.575 0.574 | 0.577 |
0.000 0.000 | 0.000 |
| 12 spectra, GPDSVFLIK | 0.000 | 0.184 | 0.000 | 0.000 | 0.225 | 0.000 | 0.590 | 0.000 | ||
| 2 spectra, GGNNLVSGYPK | 0.000 | 0.119 | 0.000 | 0.000 | 0.091 | 0.018 | 0.772 | 0.000 | ||
| 6 spectra, GATYAFSGSHYWR | 0.000 | 0.000 | 0.362 | 0.000 | 0.315 | 0.000 | 0.323 | 0.000 | ||
| 4 spectra, CNADPGLSALLSDHR | 0.000 | 0.357 | 0.000 | 0.000 | 0.000 | 0.148 | 0.496 | 0.000 | ||
| 10 spectra, DYFISCPGR | 0.000 | 0.226 | 0.000 | 0.000 | 0.194 | 0.000 | 0.580 | 0.000 | ||
| 1 spectrum, SGAQATWAELSWPHEK | 0.000 | 0.182 | 0.000 | 0.000 | 0.235 | 0.000 | 0.583 | 0.000 | ||
| 6 spectra, SLPQPQK | 0.000 | 0.276 | 0.000 | 0.000 | 0.152 | 0.000 | 0.571 | 0.000 | ||
| 9 spectra, WFWDFATR | 0.000 | 0.295 | 0.000 | 0.000 | 0.138 | 0.000 | 0.567 | 0.000 | ||
| 7 spectra, LWWLDLK | 0.000 | 0.234 | 0.000 | 0.000 | 0.188 | 0.000 | 0.578 | 0.000 | ||
| 3 spectra, GECQSEGVLFFQGNR | 0.000 | 0.125 | 0.000 | 0.180 | 0.112 | 0.000 | 0.583 | 0.000 | ||
| 15 spectra, FNPVTGEVPPR | 0.000 | 0.273 | 0.000 | 0.000 | 0.172 | 0.000 | 0.554 | 0.000 | ||
| 4 spectra, VNSILGCSQ | 0.000 | 0.322 | 0.000 | 0.000 | 0.143 | 0.000 | 0.536 | 0.000 | ||
| 8 spectra, YYCFQGNK | 0.000 | 0.203 | 0.000 | 0.000 | 0.203 | 0.000 | 0.593 | 0.000 | ||
| 34 spectra, LYVTSGR | 0.000 | 0.215 | 0.000 | 0.000 | 0.171 | 0.000 | 0.614 | 0.000 | ||
| 11 spectra, VDGALCLEK | 0.000 | 0.176 | 0.000 | 0.000 | 0.158 | 0.085 | 0.582 | 0.000 | ||
| 2 spectra, VYLIQGTQVYVFLTK | 0.000 | 0.196 | 0.000 | 0.000 | 0.244 | 0.000 | 0.560 | 0.000 | ||
| 2 spectra, VWVYPPEK | 0.000 | 0.219 | 0.000 | 0.000 | 0.124 | 0.000 | 0.657 | 0.000 | ||
| 2 spectra, YPLDAR | 0.000 | 0.166 | 0.000 | 0.000 | 0.142 | 0.143 | 0.549 | 0.000 | ||
| 7 spectra, GEFVWR | 0.000 | 0.277 | 0.000 | 0.000 | 0.183 | 0.000 | 0.540 | 0.000 | ||
| 1 spectrum, LFQEEFPGIPYPPDAAVECHR | 0.000 | 0.000 | 0.221 | 0.000 | 0.248 | 0.000 | 0.530 | 0.000 | ||
| 3 spectra, EDGLMK | 0.000 | 0.196 | 0.000 | 0.000 | 0.186 | 0.000 | 0.618 | 0.000 | ||
| 4 spectra, NPVTSVDAAFR | 0.000 | 0.171 | 0.000 | 0.000 | 0.185 | 0.000 | 0.645 | 0.000 |
| Plot | Mito | Lyso or Perox | ER | Golgi | PM | Cytosol | Nucleus | ||||||
| Expt B |
13 peptides |
57 spectra |
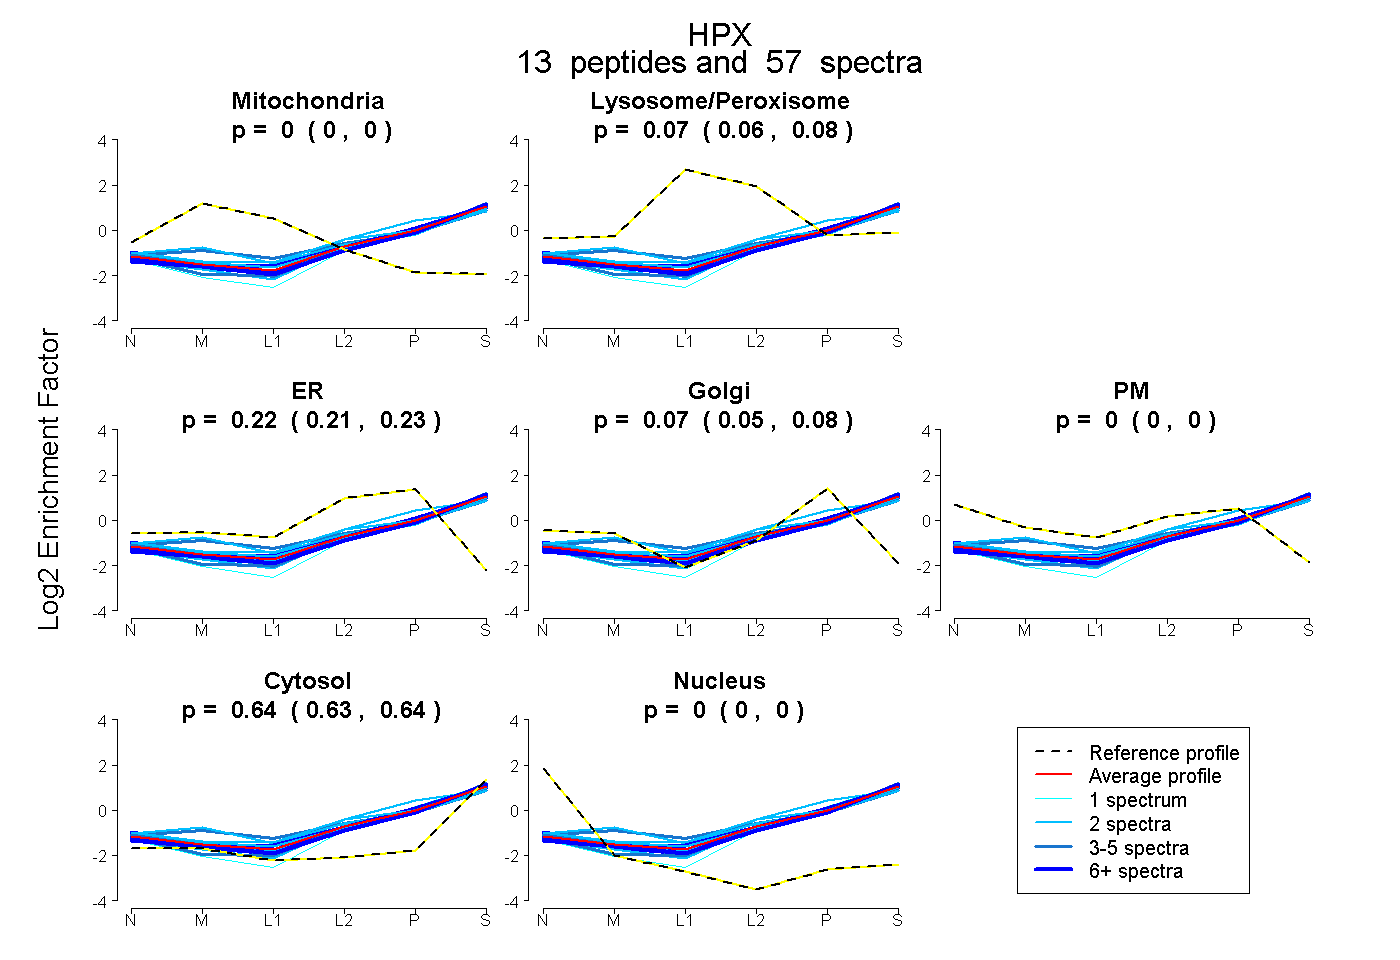 |
0.000 0.000 | 0.000 |
0.071 0.063 | 0.077 |
0.222 0.206 | 0.235 |
0.068 0.055 | 0.079 |
0.000 0.000 | 0.000 |
0.639 0.635 | 0.644 |
0.000 0.000 | 0.000 |
|||
| Plot | Lyso | Other | |||||||||||
| Expt C |
21 peptides |
327 spectra |
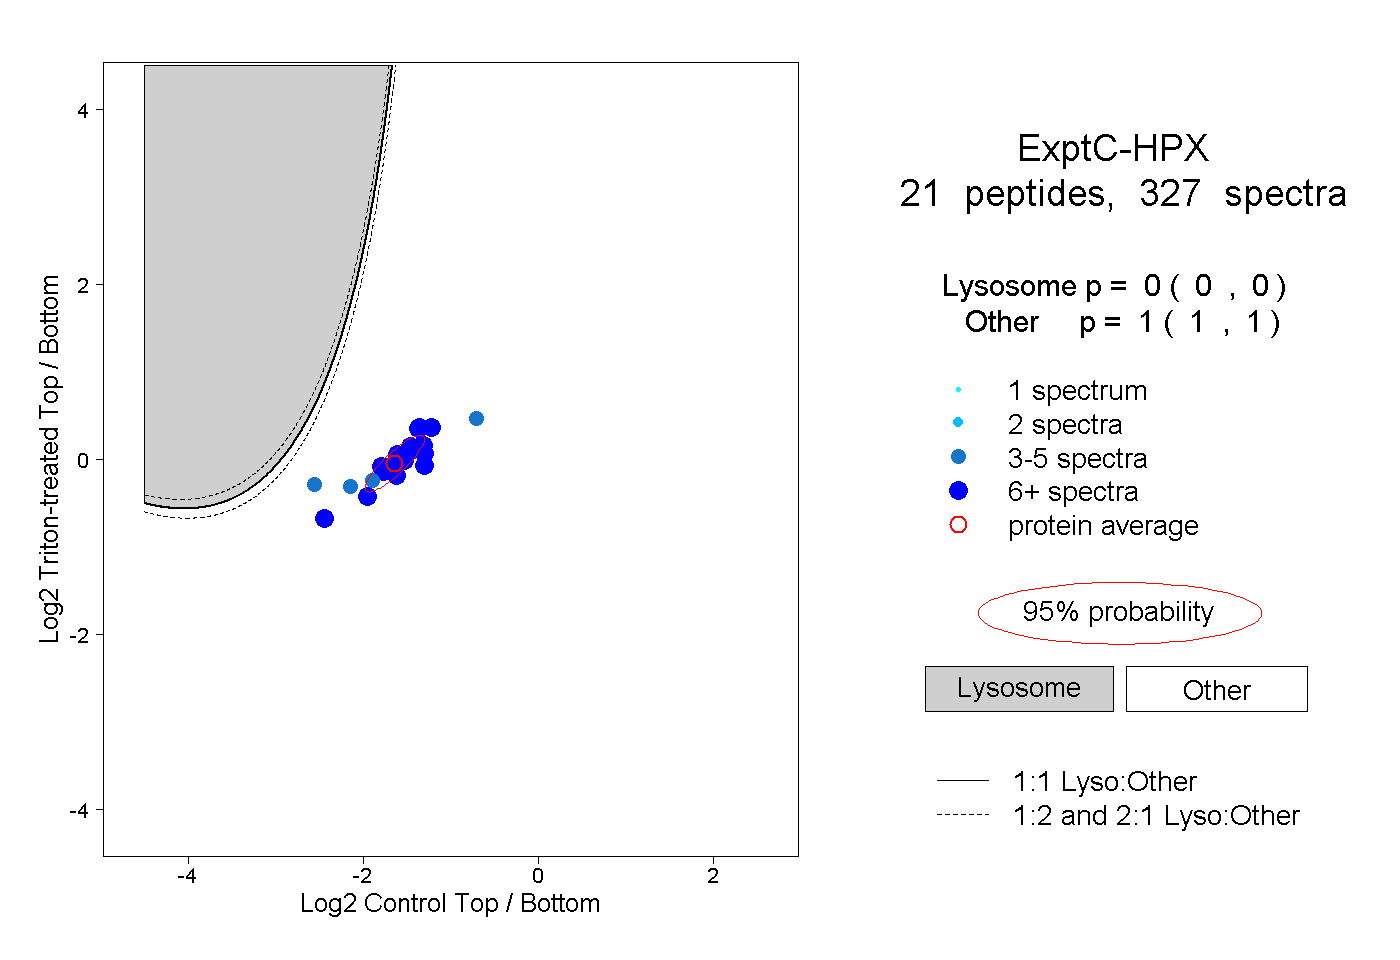 |
0.000 0.000 | 0.000 |
1.000 1.000 | 1.000 |
||||||||
| Plot | Lyso | Other | |||||||||||
| Expt D |
15 peptides |
43 spectra |
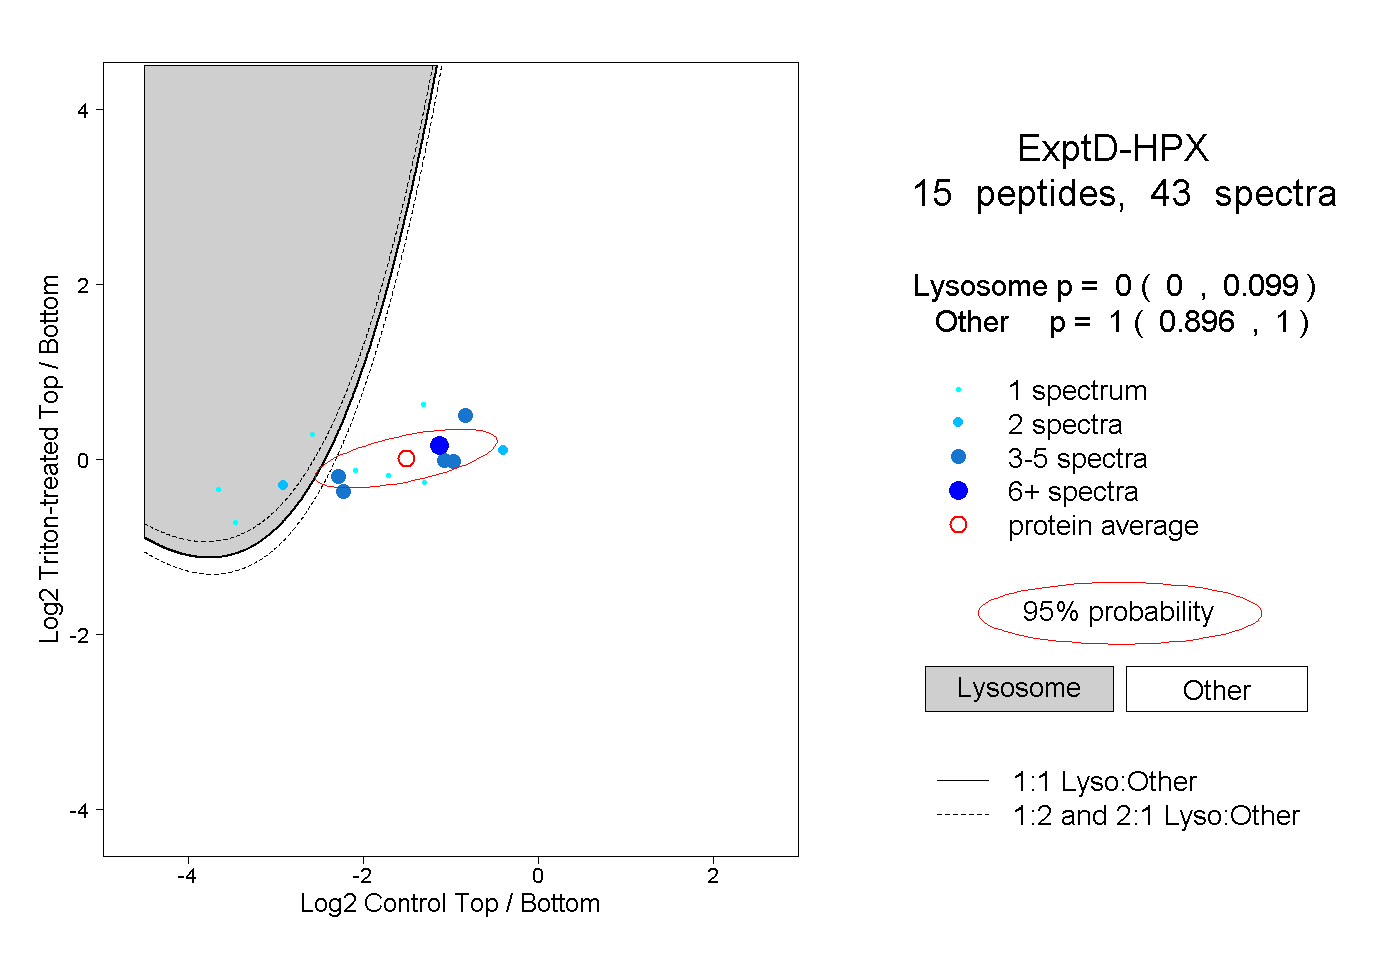 |
0.000 0.000 | 0.099 |
1.000 0.896 | 1.000 |