 13
13peptides
spectra
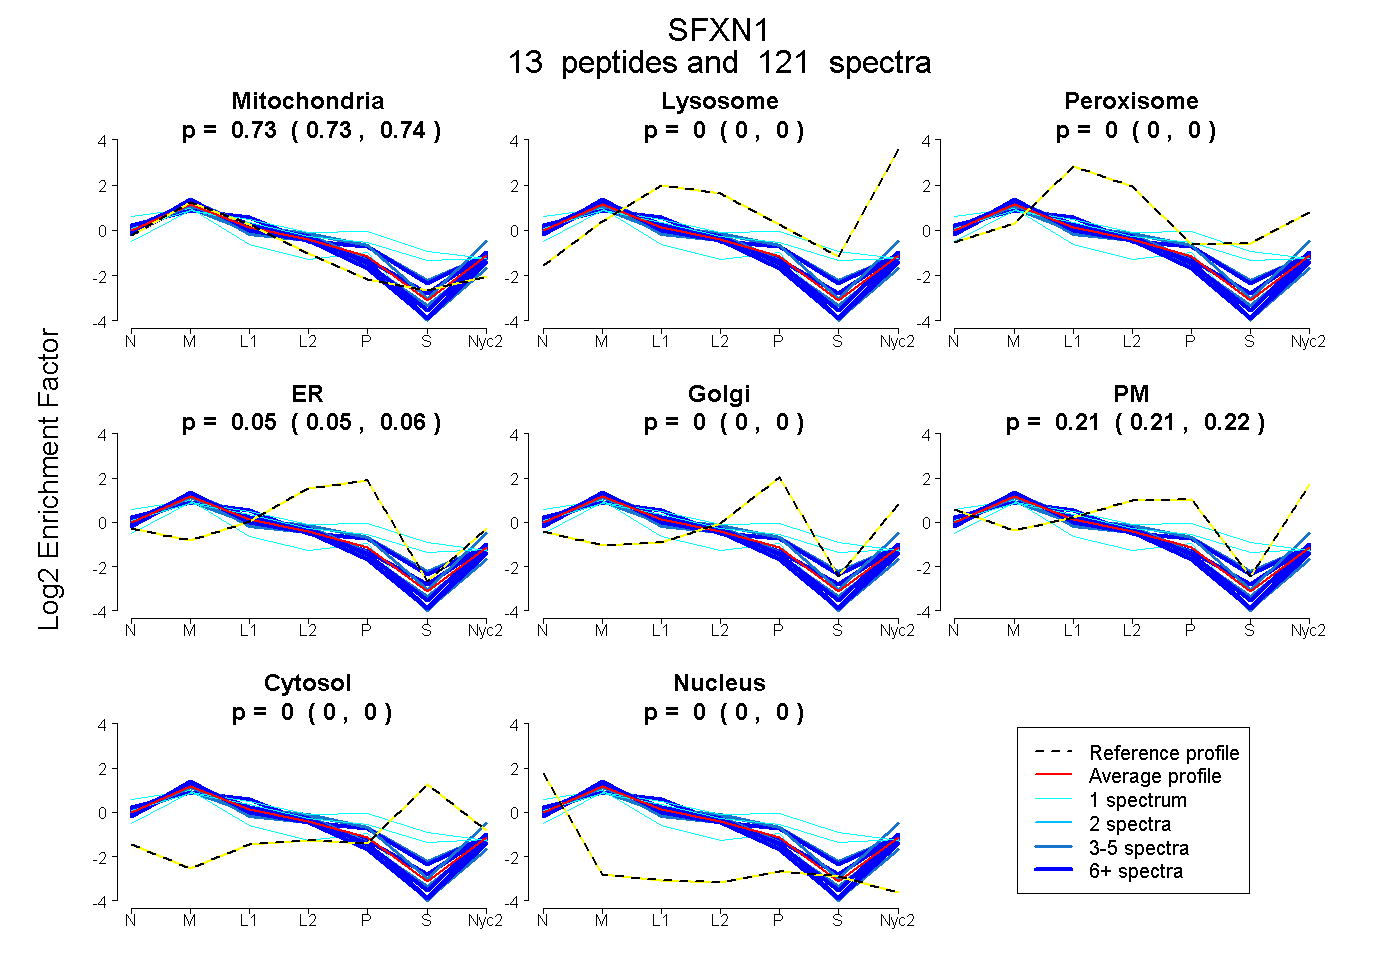
0.731 | 0.737
0.000 | 0.000
0.000 | 0.000
0.048 | 0.059
0.000 | 0.000
0.208 | 0.216
0.000 | 0.000
0.000 | 0.000
10peptides
spectra
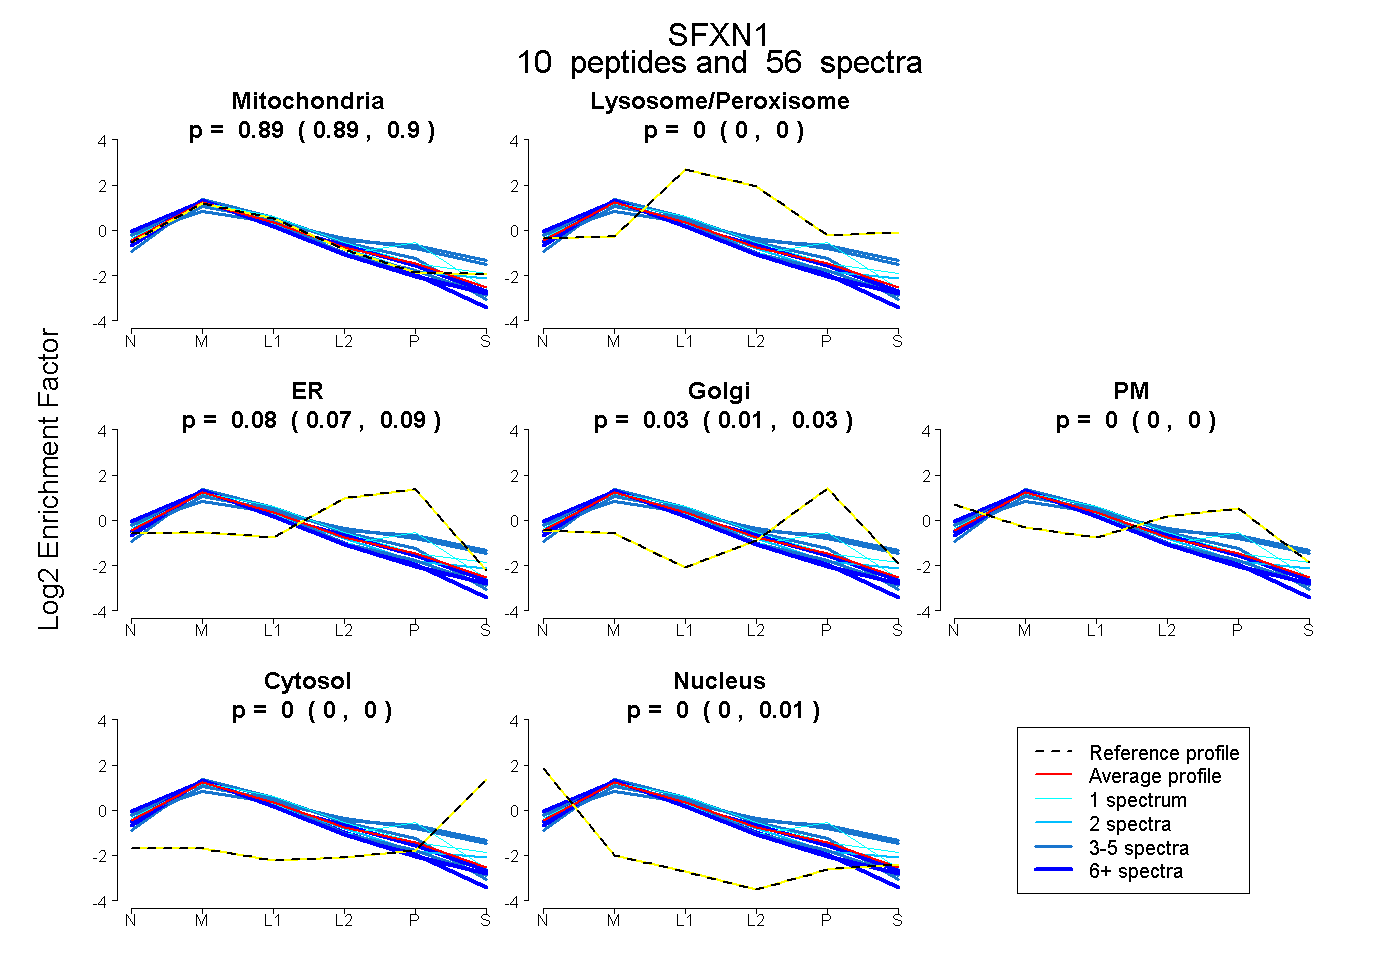
0.887 | 0.900
0.000 | 0.000
0.069 | 0.092
0.007 | 0.033
0.000 | 0.000
0.000 | 0.000
0.000 | 0.006
12peptides
spectra
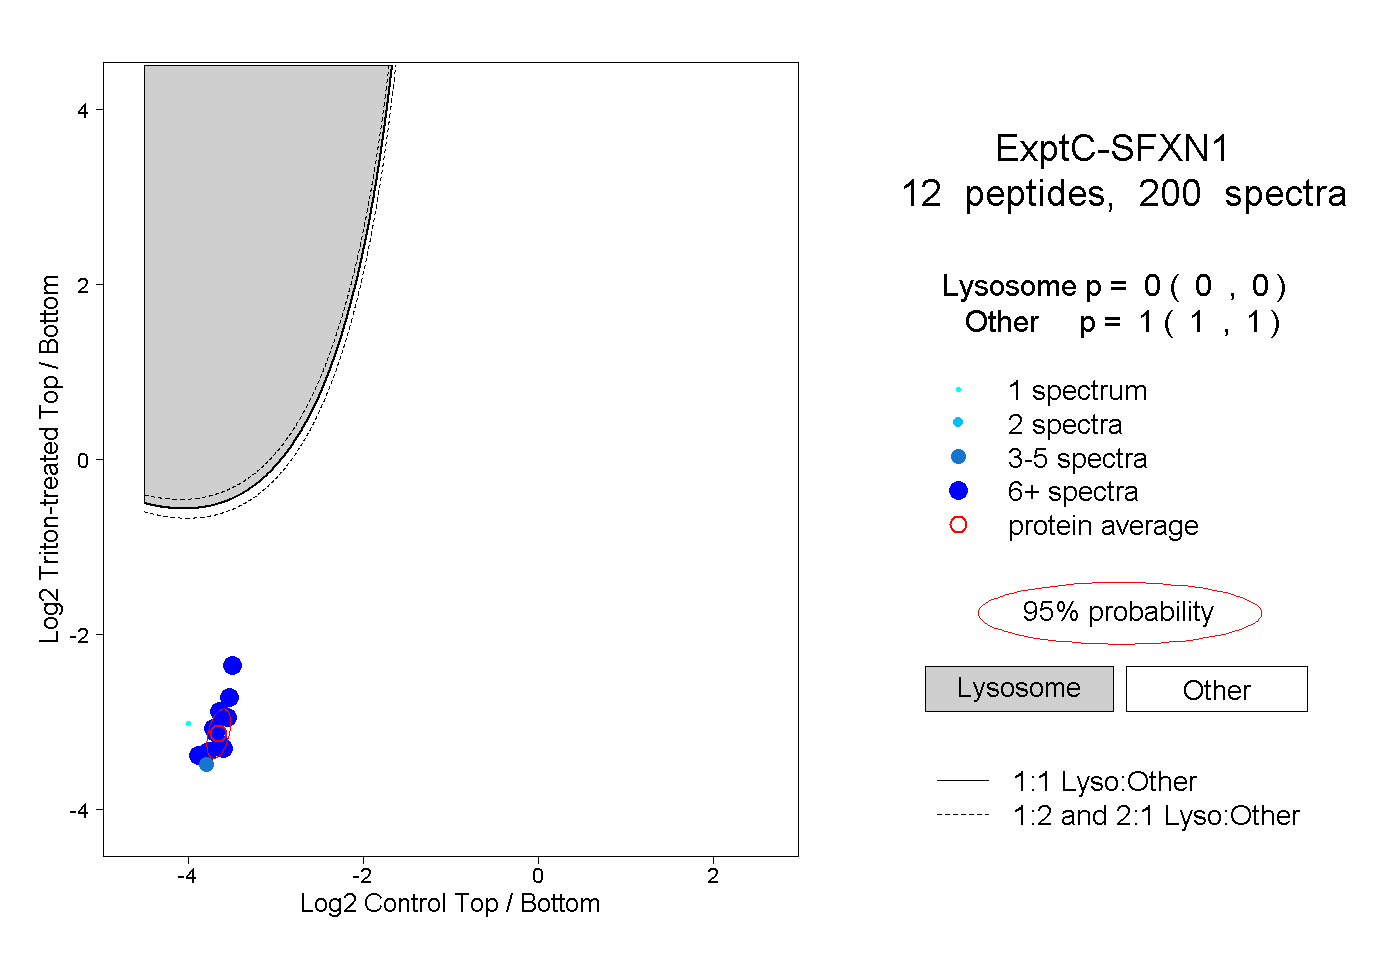
0.000 | 0.000
1.000 | 1.000
7peptides
spectra
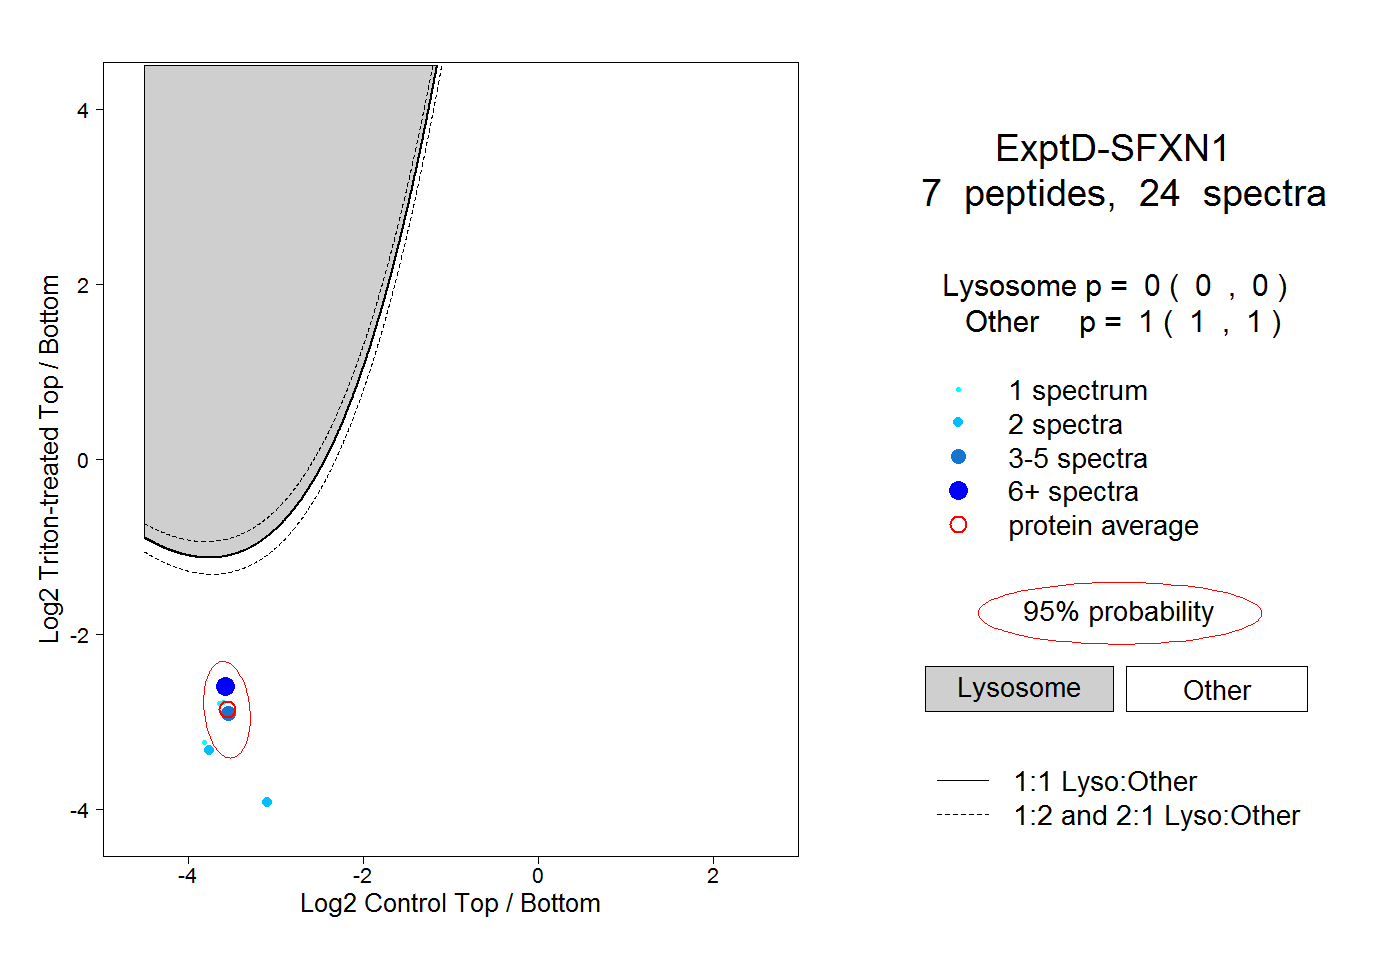
0.000 | 0.000
1.000 | 1.000