 3
3peptides
spectra
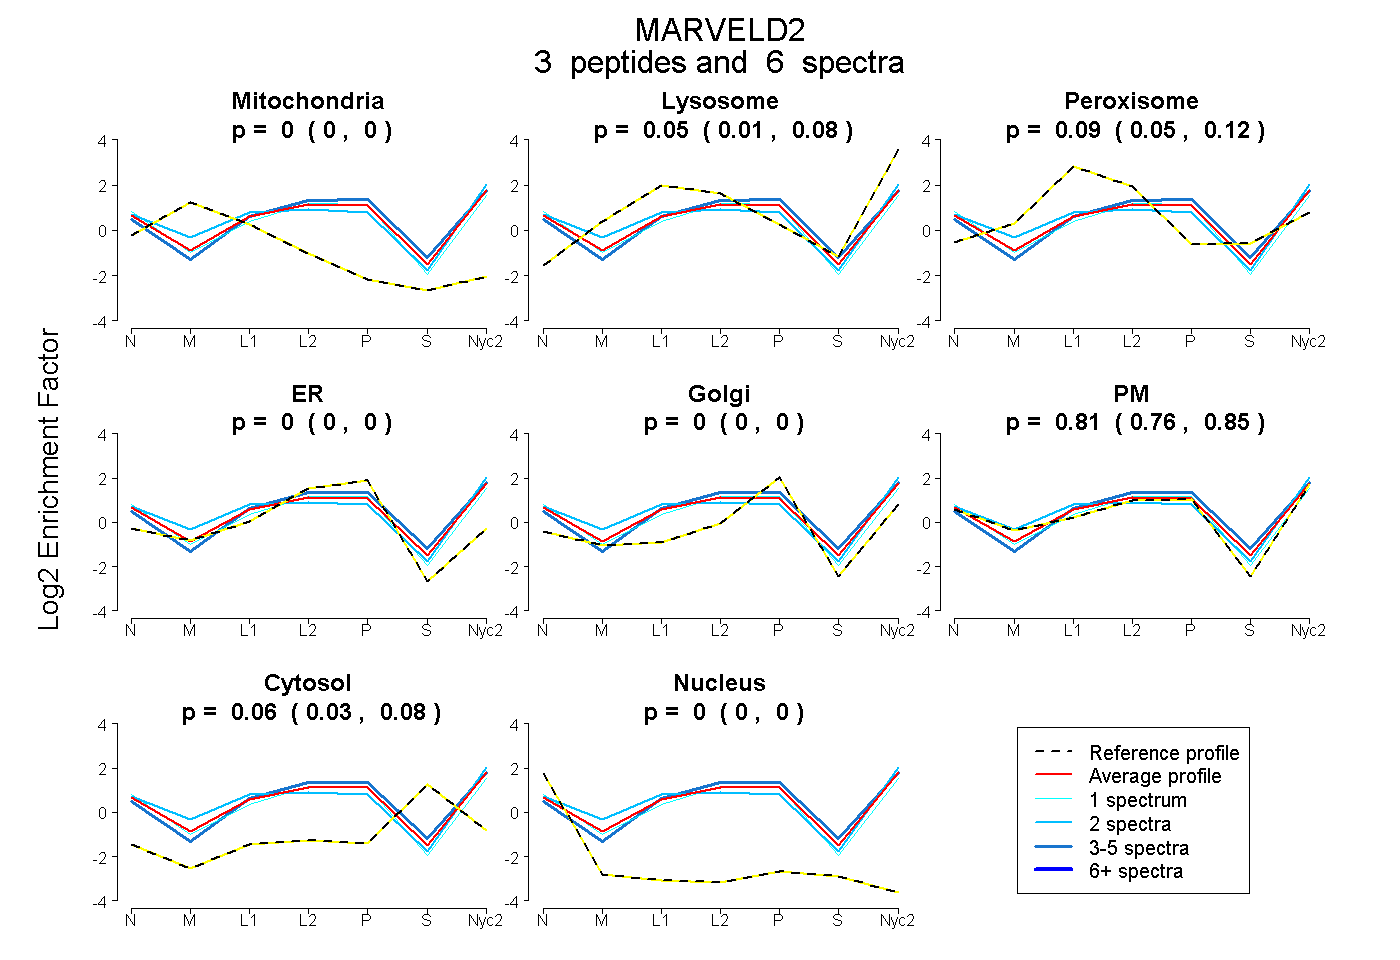
0.000 | 0.000
0.008 | 0.083
0.045 | 0.123
0.000 | 0.000
0.000 | 0.000
0.761 | 0.846
0.031 | 0.079
0.000 | 0.000
| Plot | Mito | Lyso | Perox | ER | Golgi | PM | Cytosol | Nucleus | |||||
| Expt A |
3 peptides |
6 spectra |
|
0.000 0.000 | 0.000 |
0.046 0.008 | 0.083 |
0.088 0.045 | 0.123 |
0.000 0.000 | 0.000 |
0.000 0.000 | 0.000 |
0.809 0.761 | 0.846 |
0.057 0.031 | 0.079 |
0.000 0.000 | 0.000 |
| 3 spectra, DYSEVPR | 0.000 | 0.121 | 0.042 | 0.072 | 0.000 | 0.675 | 0.089 | 0.000 | ||
| 2 spectra, SWAGLLR | 0.000 | 0.093 | 0.106 | 0.000 | 0.000 | 0.791 | 0.010 | 0.000 | ||
| 1 spectrum, ELSAEVQATLR | 0.000 | 0.000 | 0.032 | 0.046 | 0.000 | 0.878 | 0.044 | 0.000 |
| Plot | Lyso | Other | |||||||||||
| Expt C |
3 peptides |
4 spectra |
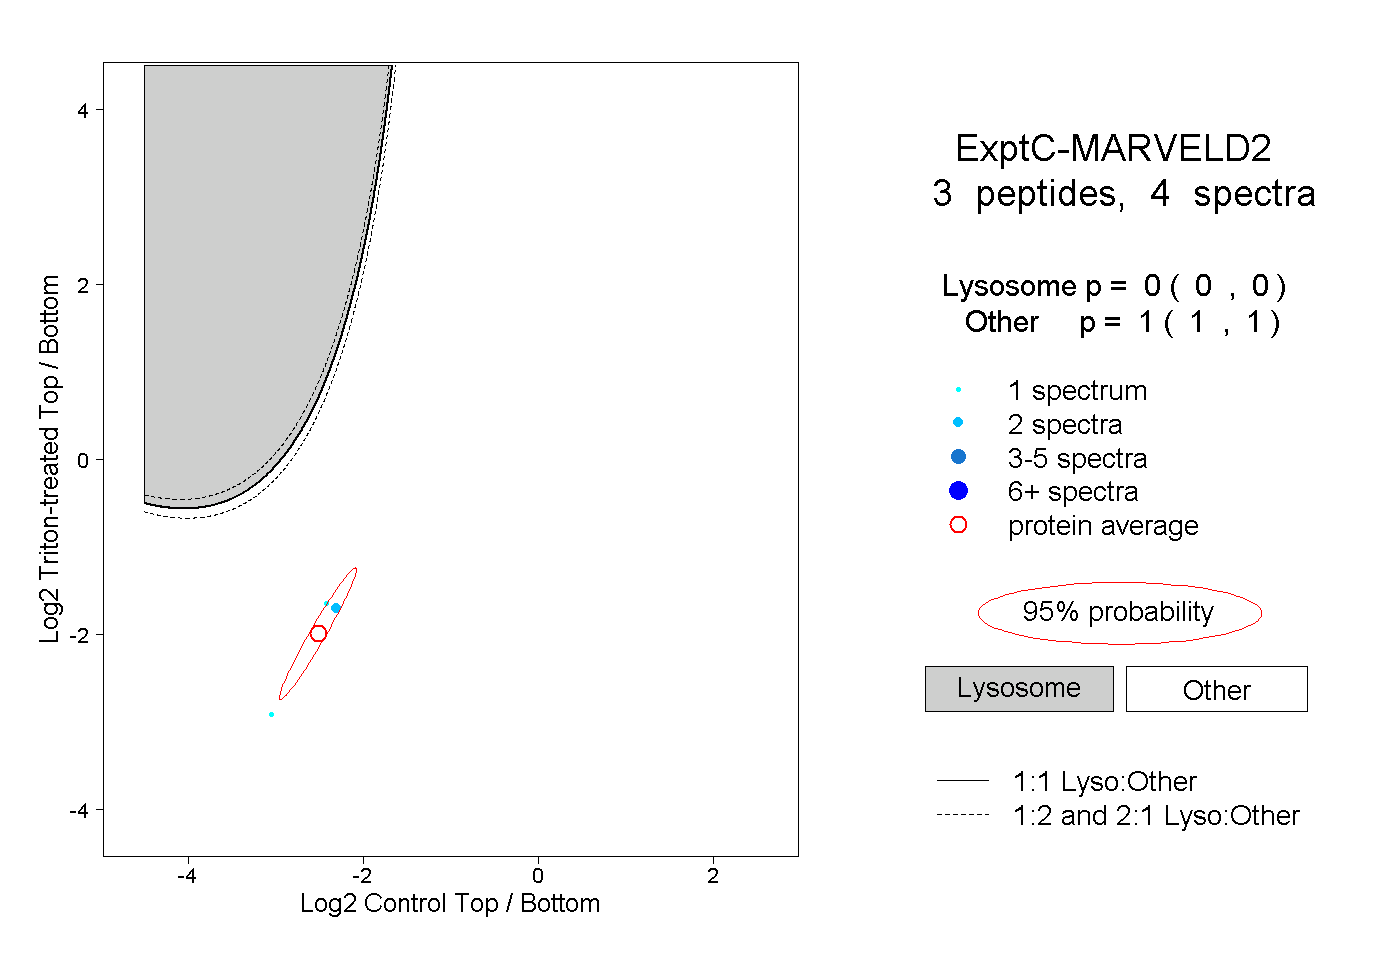 |
0.000 0.000 | 0.000 |
1.000 1.000 | 1.000 |