 3
3peptides
spectra
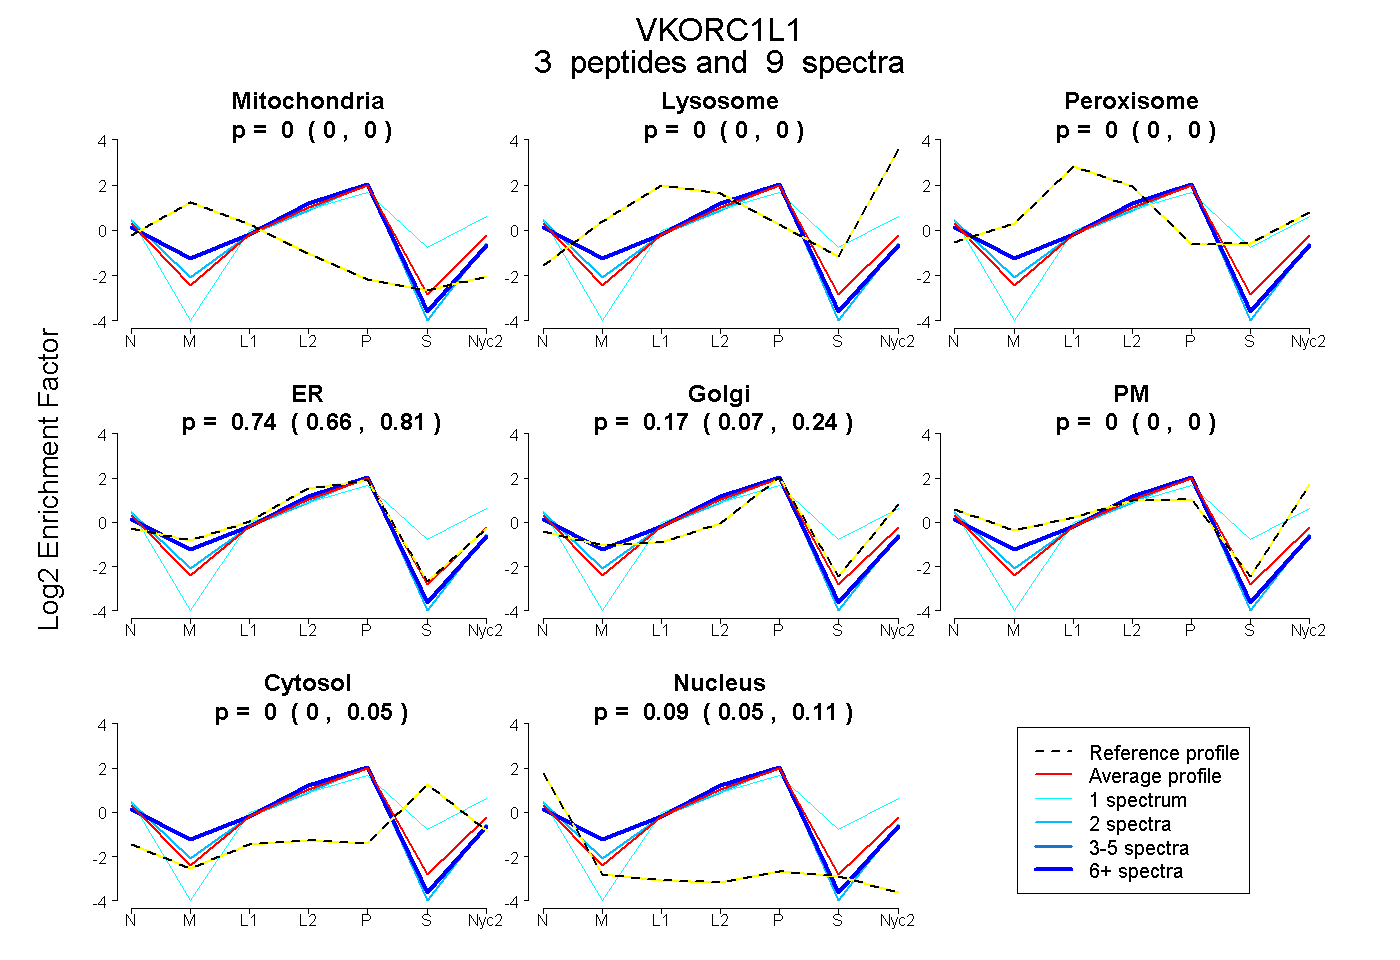
0.000 | 0.000
0.000 | 0.000
0.000 | 0.000
0.663 | 0.815
0.065 | 0.241
0.000 | 0.000
0.000 | 0.052
0.047 | 0.108
4peptides
spectra
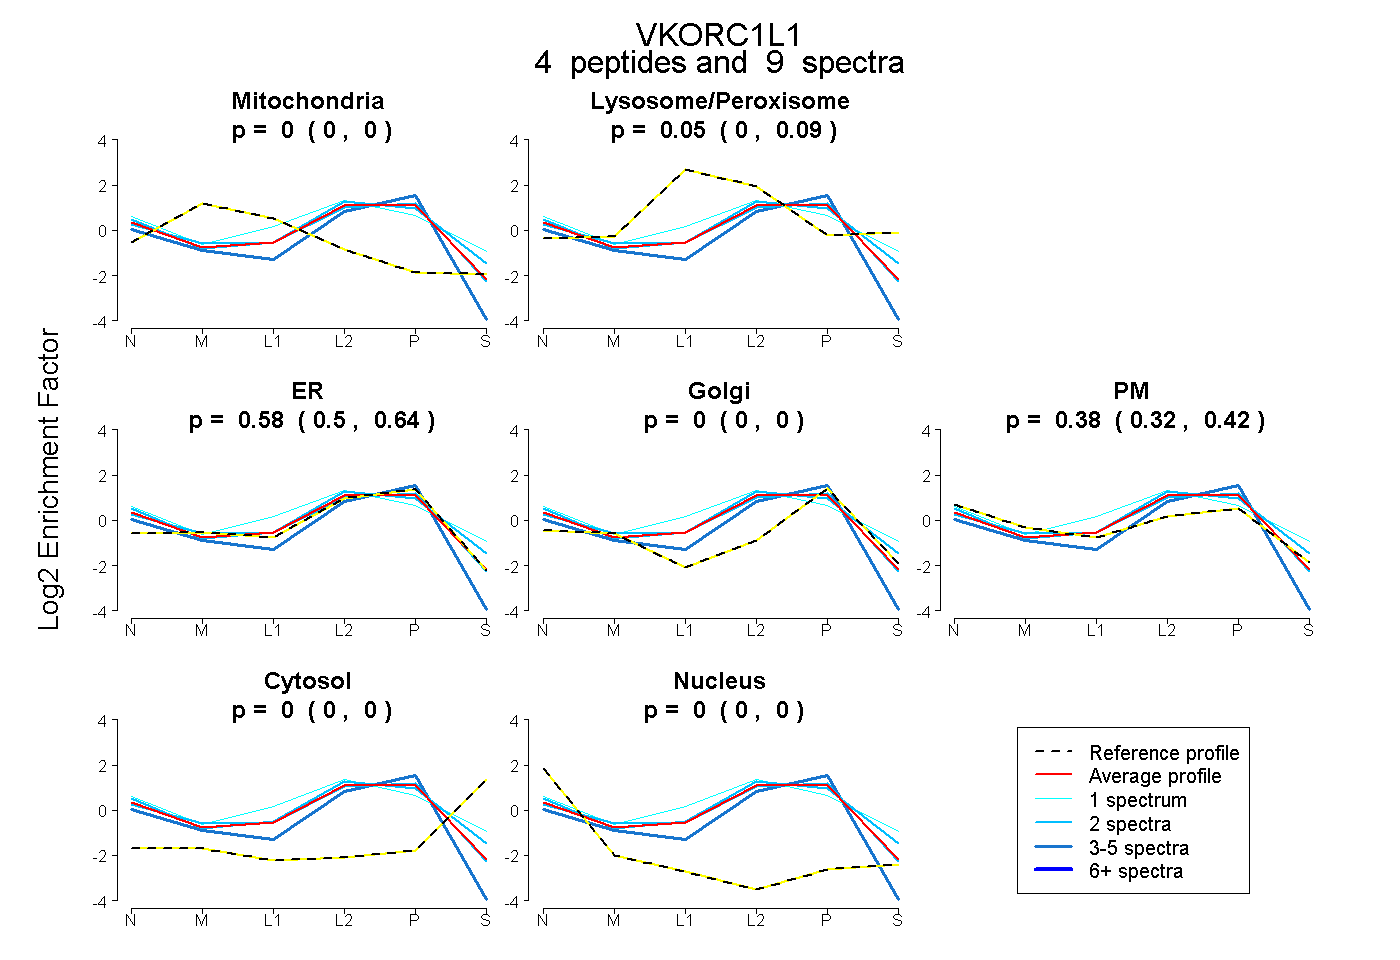
0.000 | 0.000
0.000 | 0.092
0.495 | 0.645
0.000 | 0.000
0.323 | 0.422
0.000 | 0.000
0.000 | 0.000
3peptides
spectra
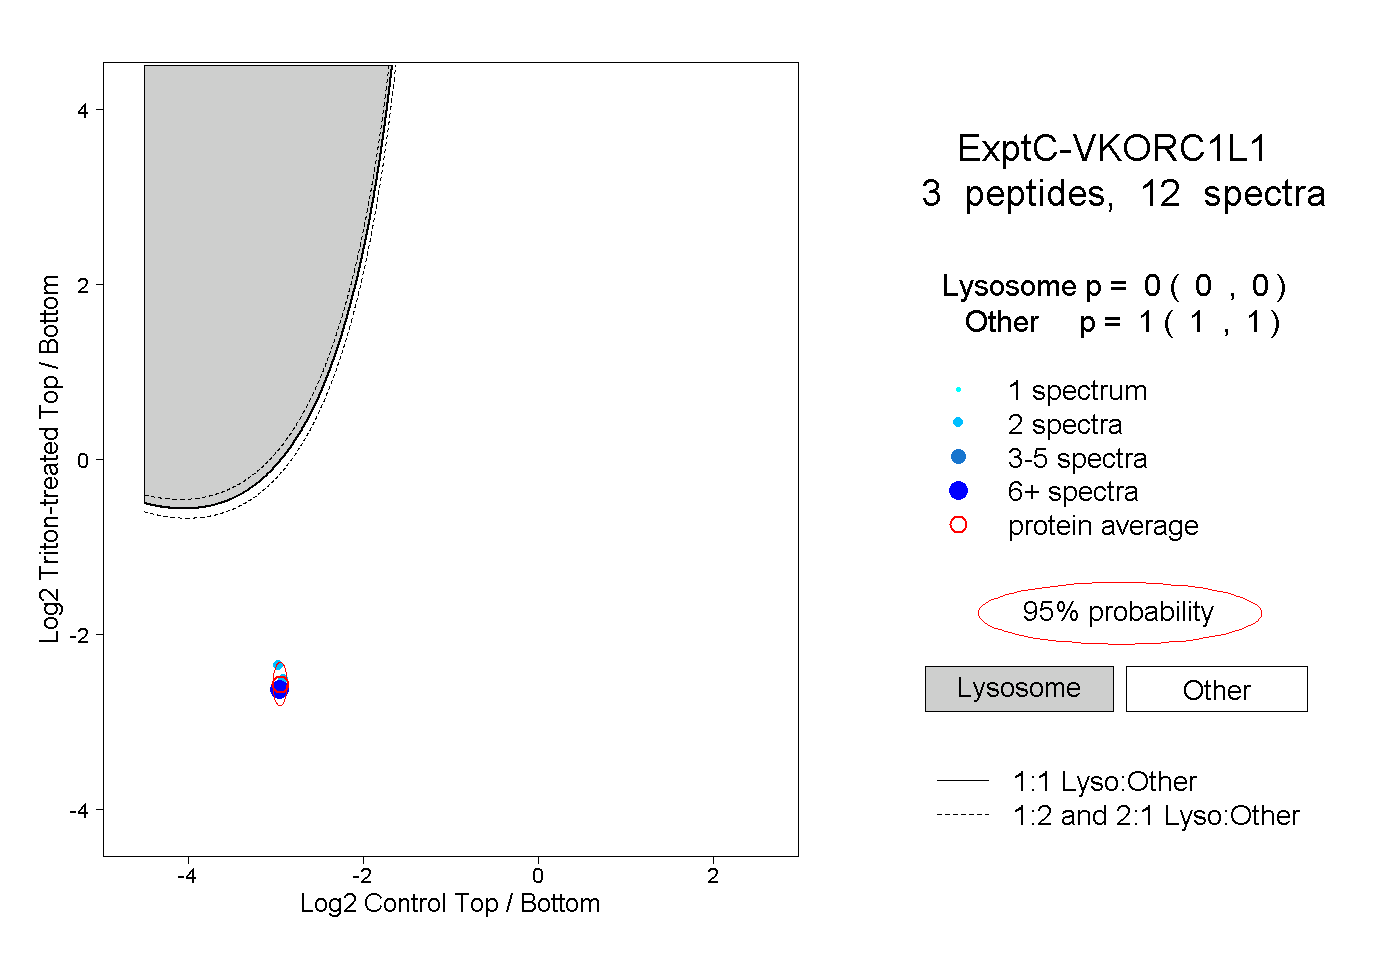
0.000 | 0.000
1.000 | 1.000
1peptide
spectrum
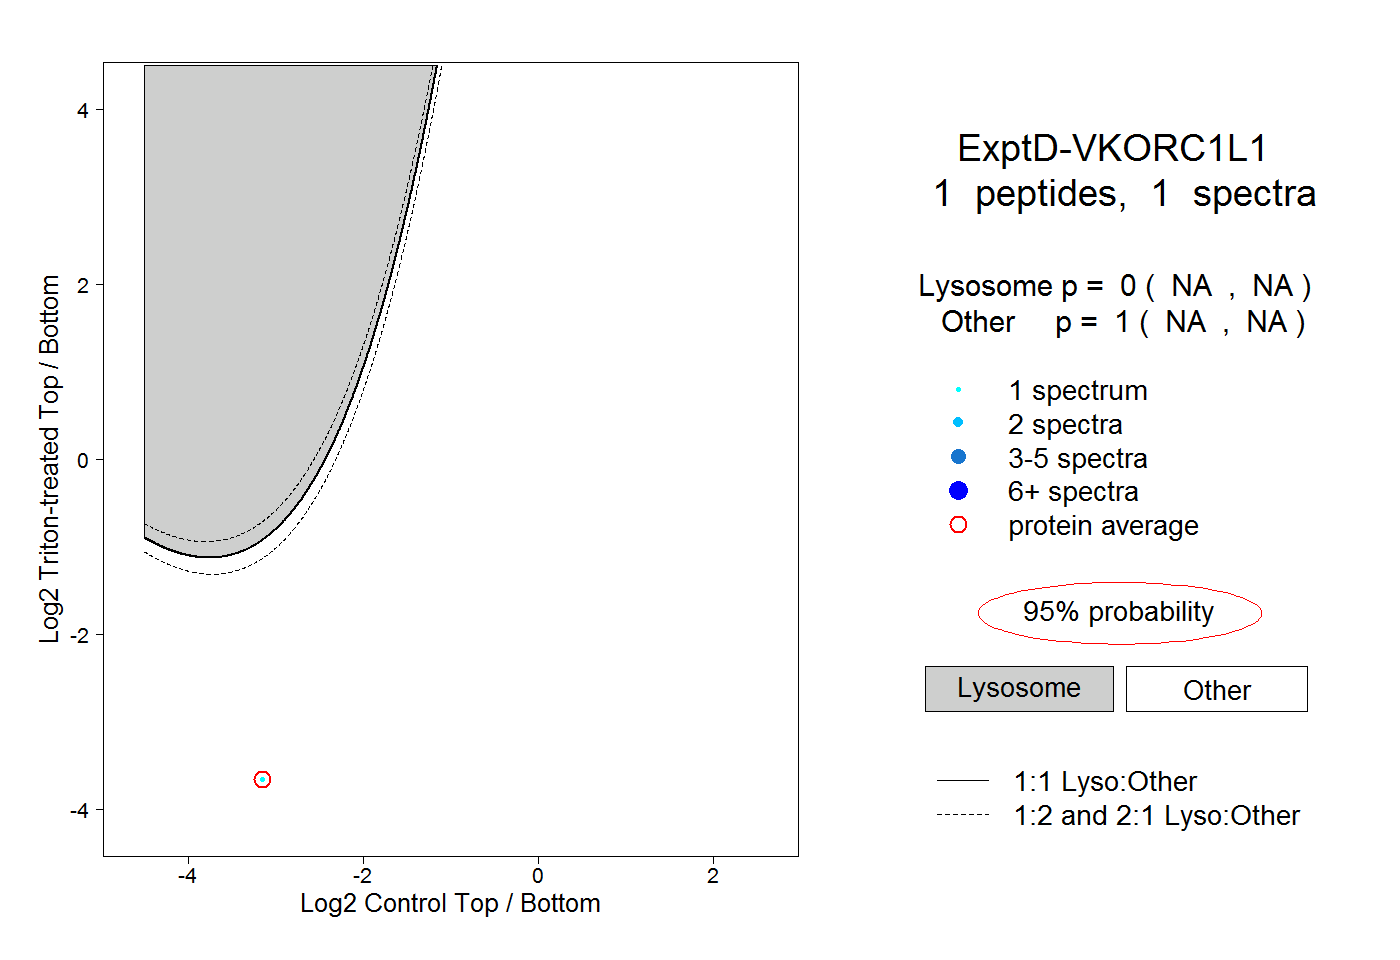
NA | NA
NA | NA