 4
4peptides
spectra
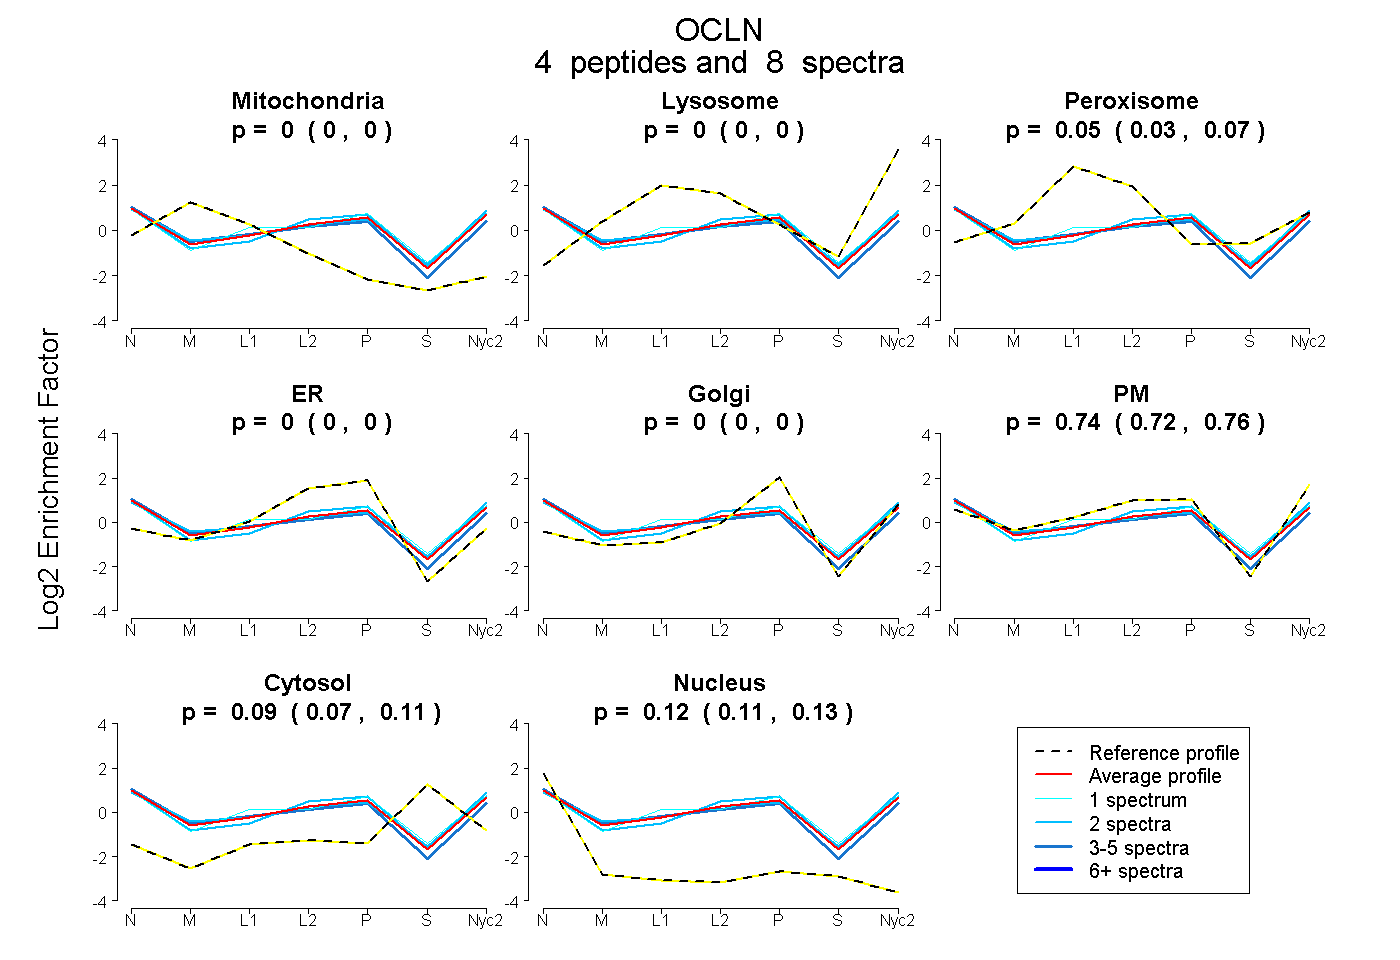
0.000 | 0.000
0.000 | 0.000
0.026 | 0.066
0.000 | 0.000
0.000 | 0.000
0.722 | 0.764
0.069 | 0.106
0.106 | 0.129
1peptide
spectrum
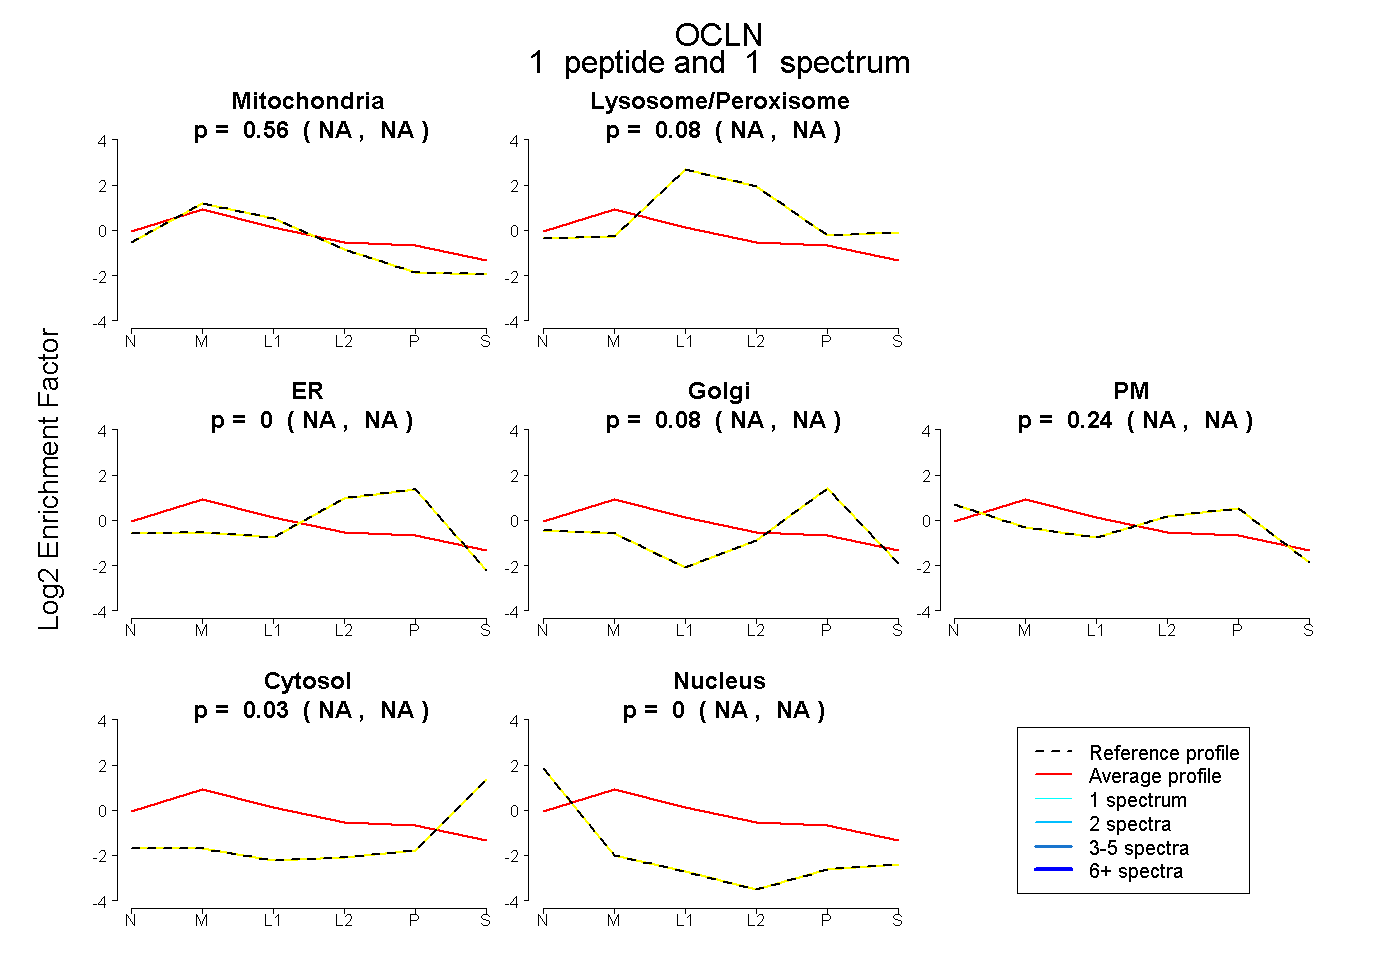
NA | NA
NA | NA
NA | NA
NA | NA
NA | NA
NA | NA
NA | NA
3peptides
spectra
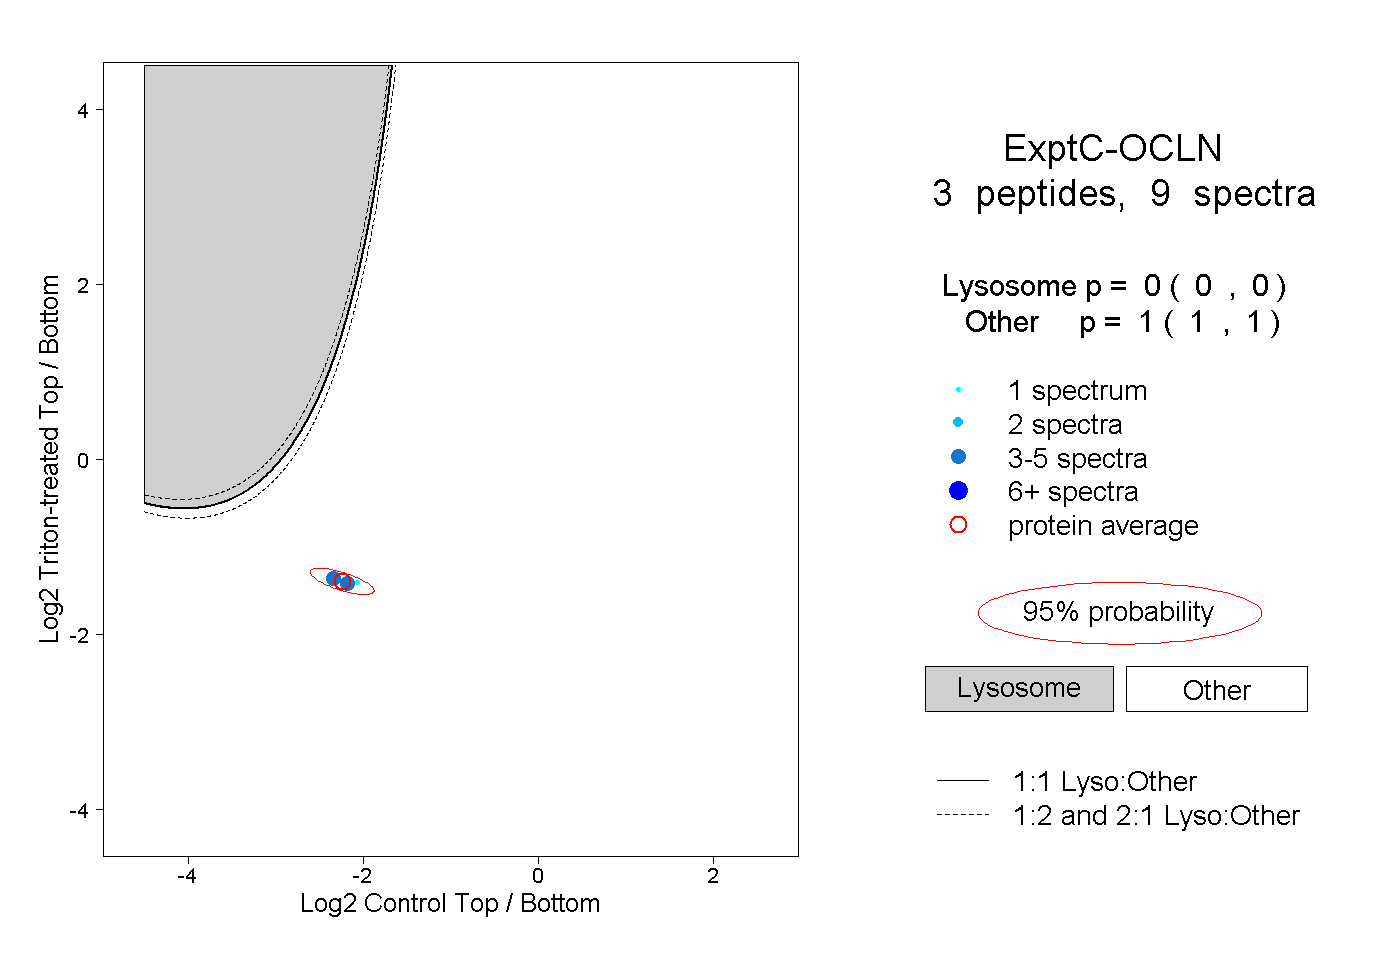
0.000 | 0.000
1.000 | 1.000
1peptide
spectrum
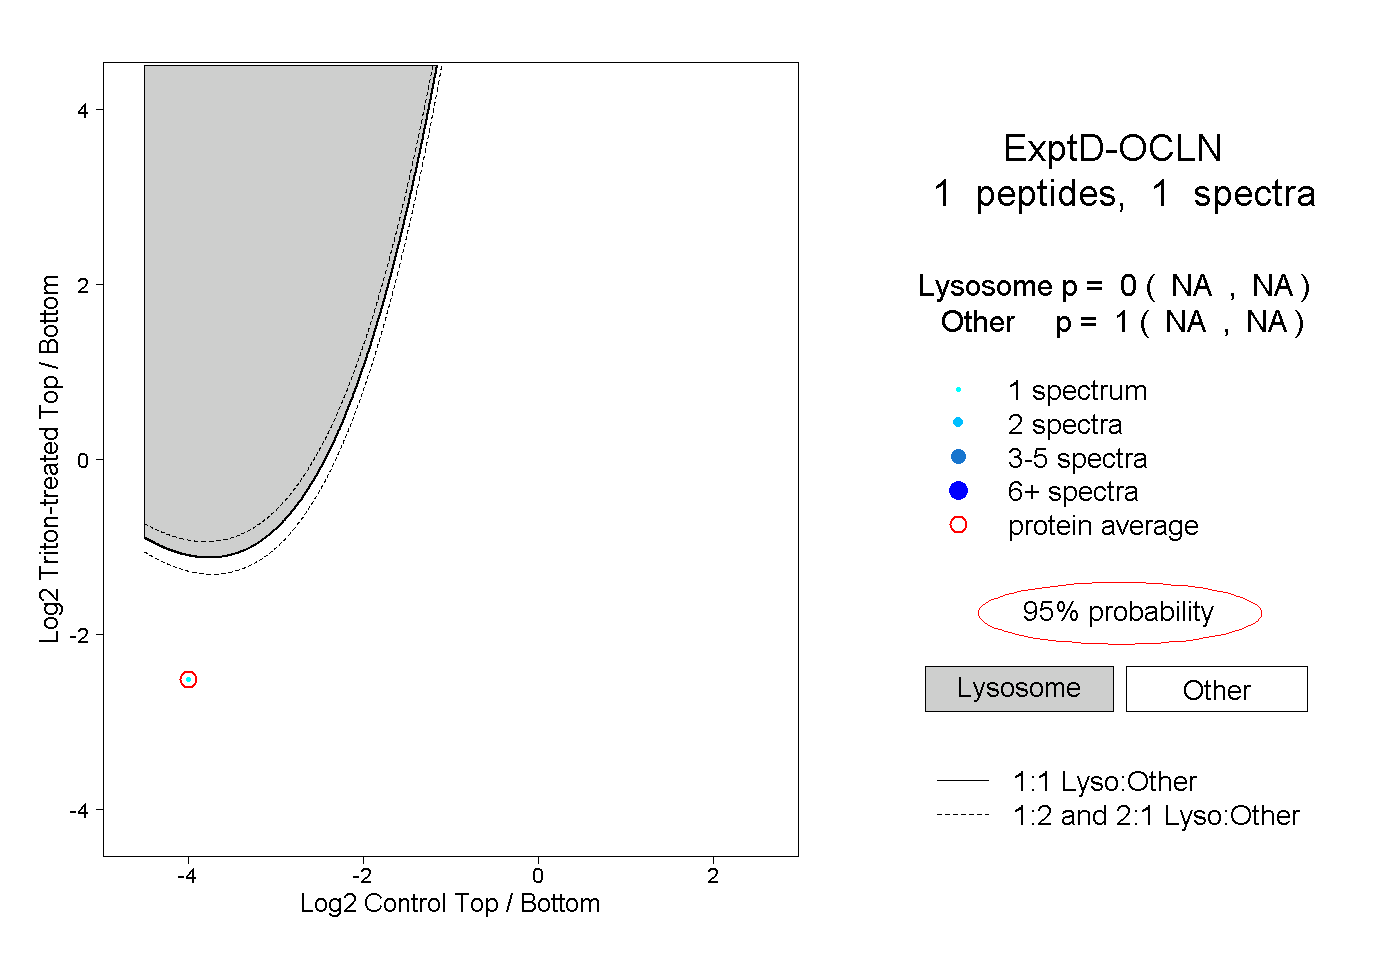
NA | NA
NA | NA