 4
4peptides
spectra
0.000 | 0.000
0.000 | 0.000
0.026 | 0.066
0.000 | 0.000
0.000 | 0.000
0.722 | 0.764
0.069 | 0.106
0.106 | 0.129
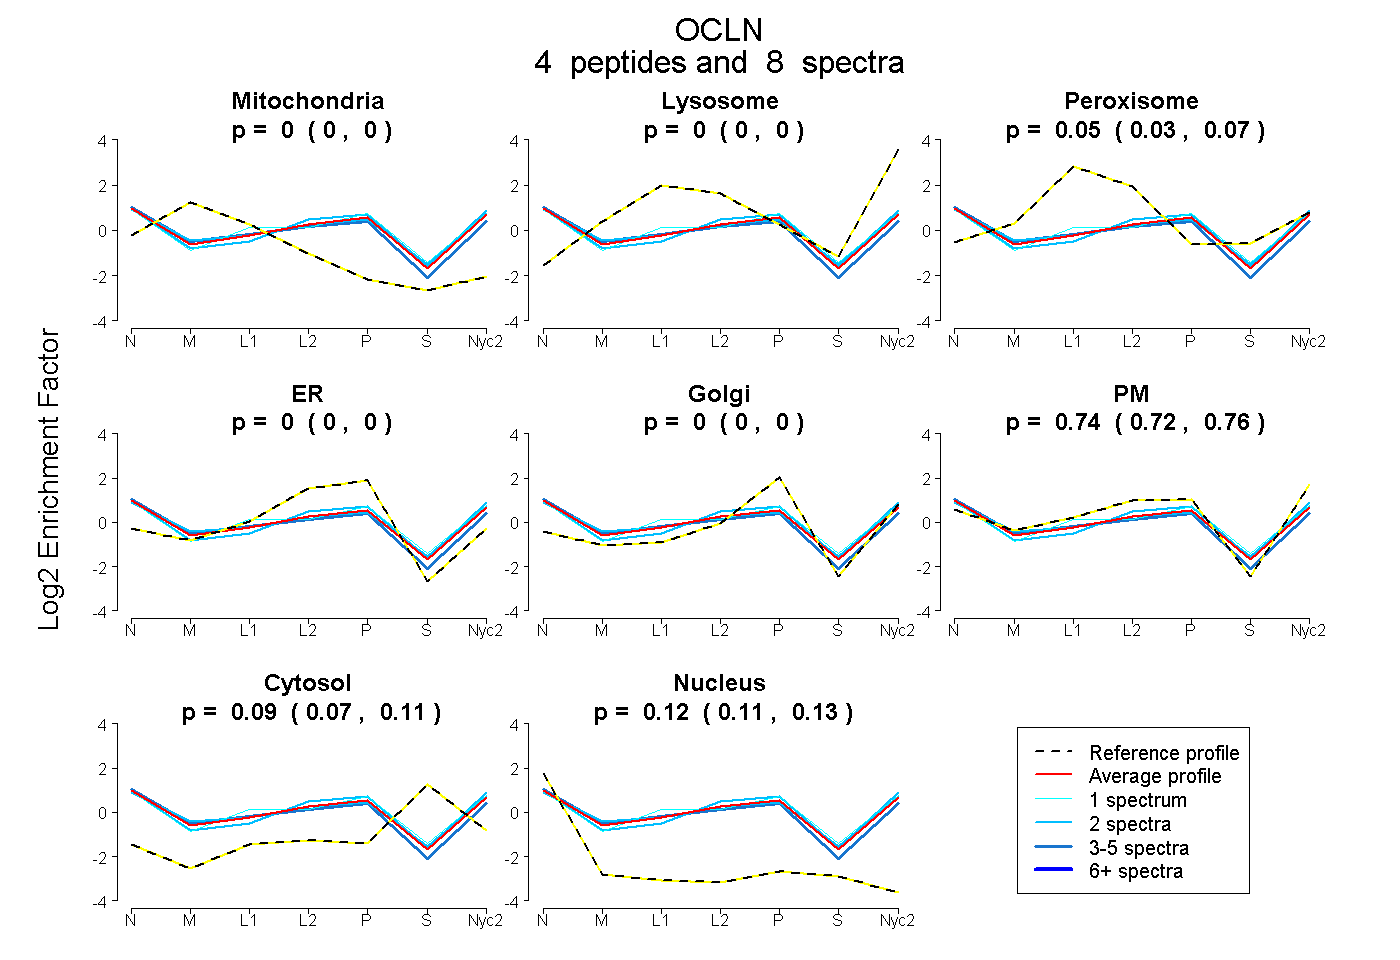
| Plot | Mito | Lyso | Perox | ER | Golgi | PM | Cytosol | Nucleus | |||||
| Expt A |
4 peptides |
8 spectra |
|
0.000 0.000 | 0.000 |
0.000 0.000 | 0.000 |
0.048 0.026 | 0.066 |
0.000 0.000 | 0.000 |
0.000 0.000 | 0.000 |
0.745 0.722 | 0.764 |
0.089 0.069 | 0.106 |
0.119 0.106 | 0.129 |
| 1 spectrum, SYPDSLYK | 0.000 | 0.000 | 0.057 | 0.000 | 0.000 | 0.724 | 0.141 | 0.079 | ||
| 2 spectra, GSADYK | 0.013 | 0.000 | 0.057 | 0.000 | 0.000 | 0.723 | 0.110 | 0.096 | ||
| 2 spectra, SLLAELDEVNK | 0.000 | 0.000 | 0.000 | 0.000 | 0.000 | 0.796 | 0.124 | 0.081 | ||
| 3 spectra, EYPPITSDQQR | 0.020 | 0.000 | 0.089 | 0.001 | 0.000 | 0.702 | 0.000 | 0.188 |
| Plot | Mito | Lyso or Perox | ER | Golgi | PM | Cytosol | Nucleus | ||||||
| Expt B |
1 peptide |
1 spectrum |
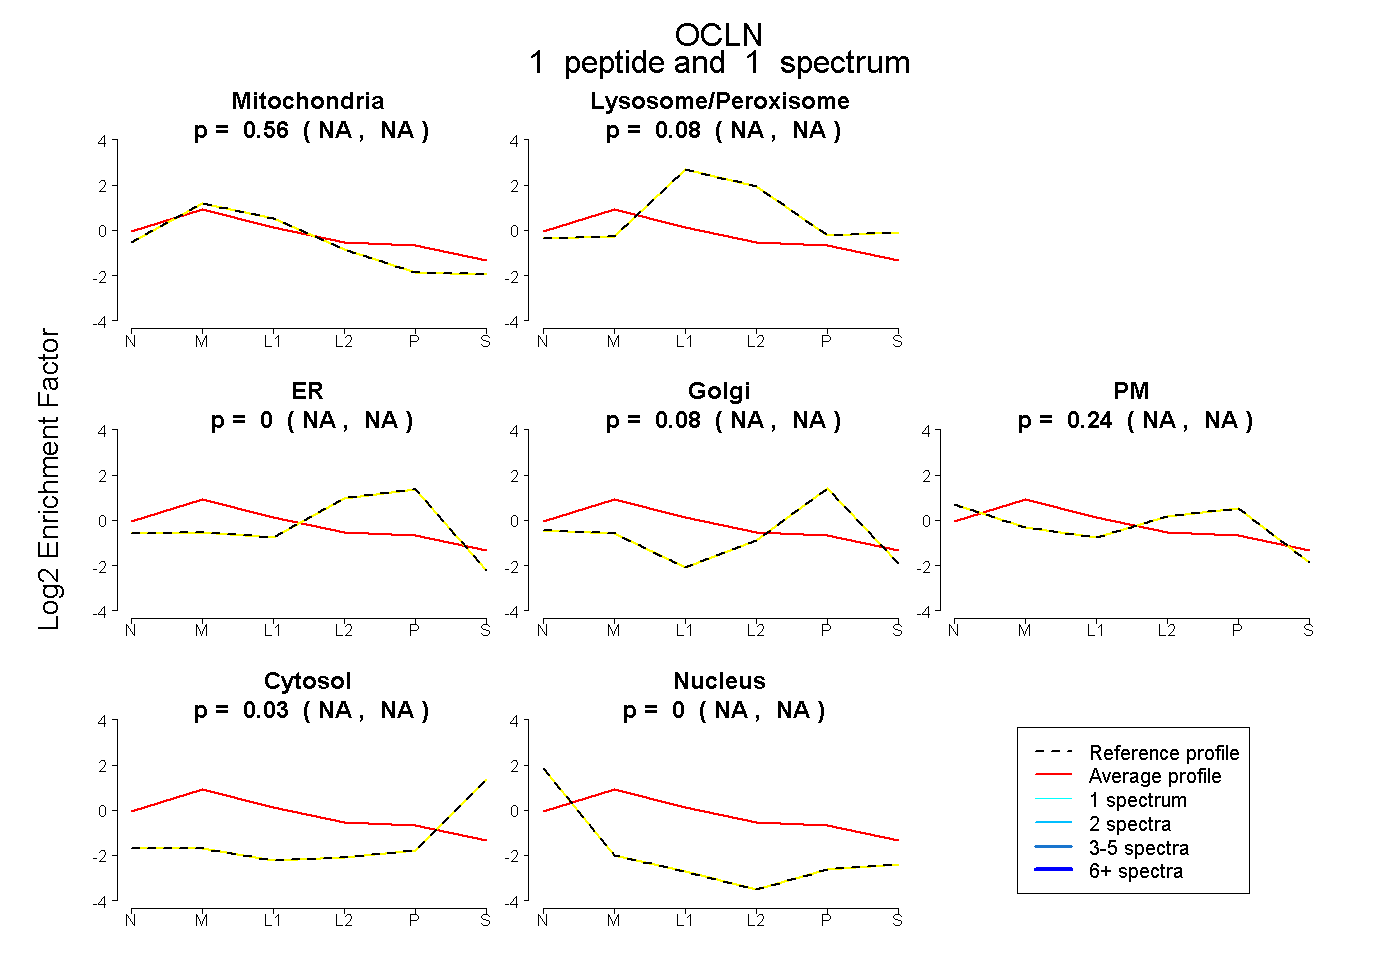 |
0.564 NA | NA |
0.085 NA | NA |
0.000 NA | NA |
0.081 NA | NA |
0.245 NA | NA |
0.025 NA | NA |
0.000 NA | NA |
|||
| Plot | Lyso | Other | |||||||||||
| Expt C |
3 peptides |
9 spectra |
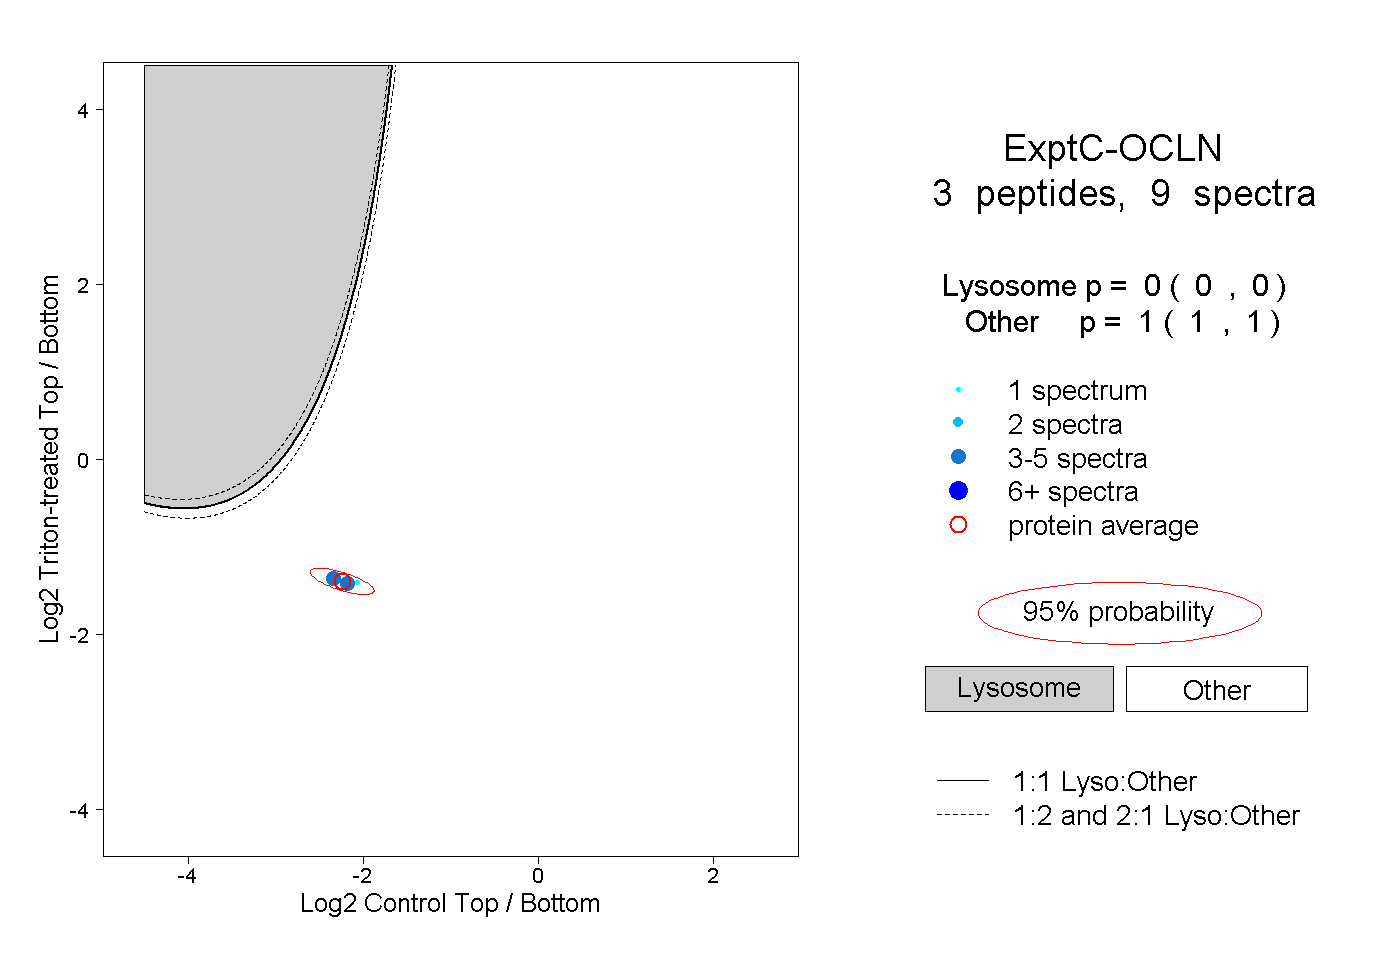 |
0.000 0.000 | 0.000 |
1.000 1.000 | 1.000 |
||||||||
| Plot | Lyso | Other | |||||||||||
| Expt D |
1 peptide |
1 spectrum |
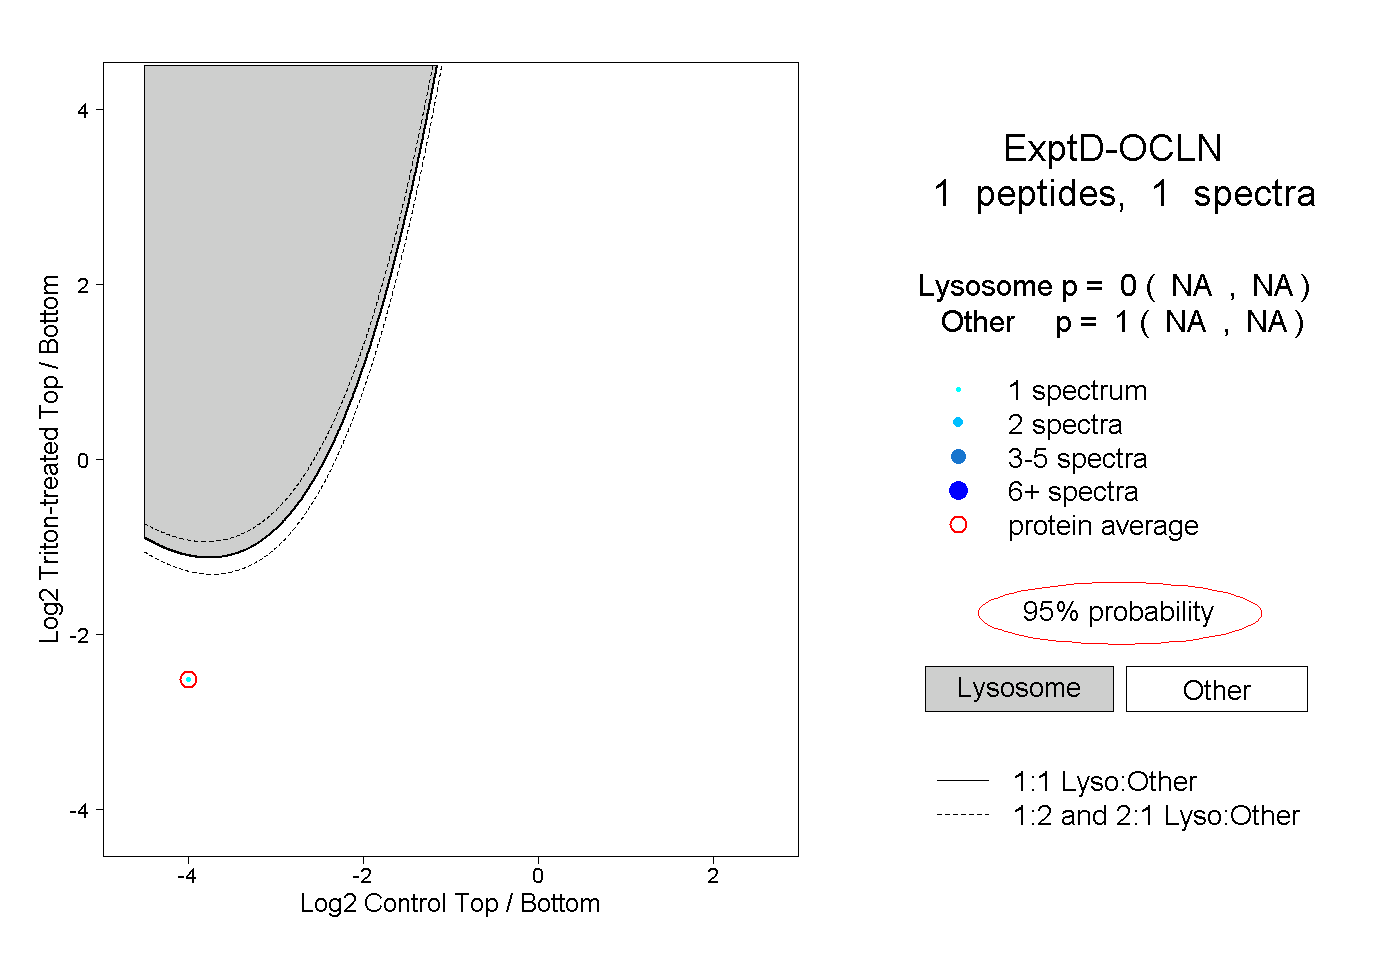 |
0.000 NA | NA |
1.000 NA | NA |