 12
12peptides
spectra
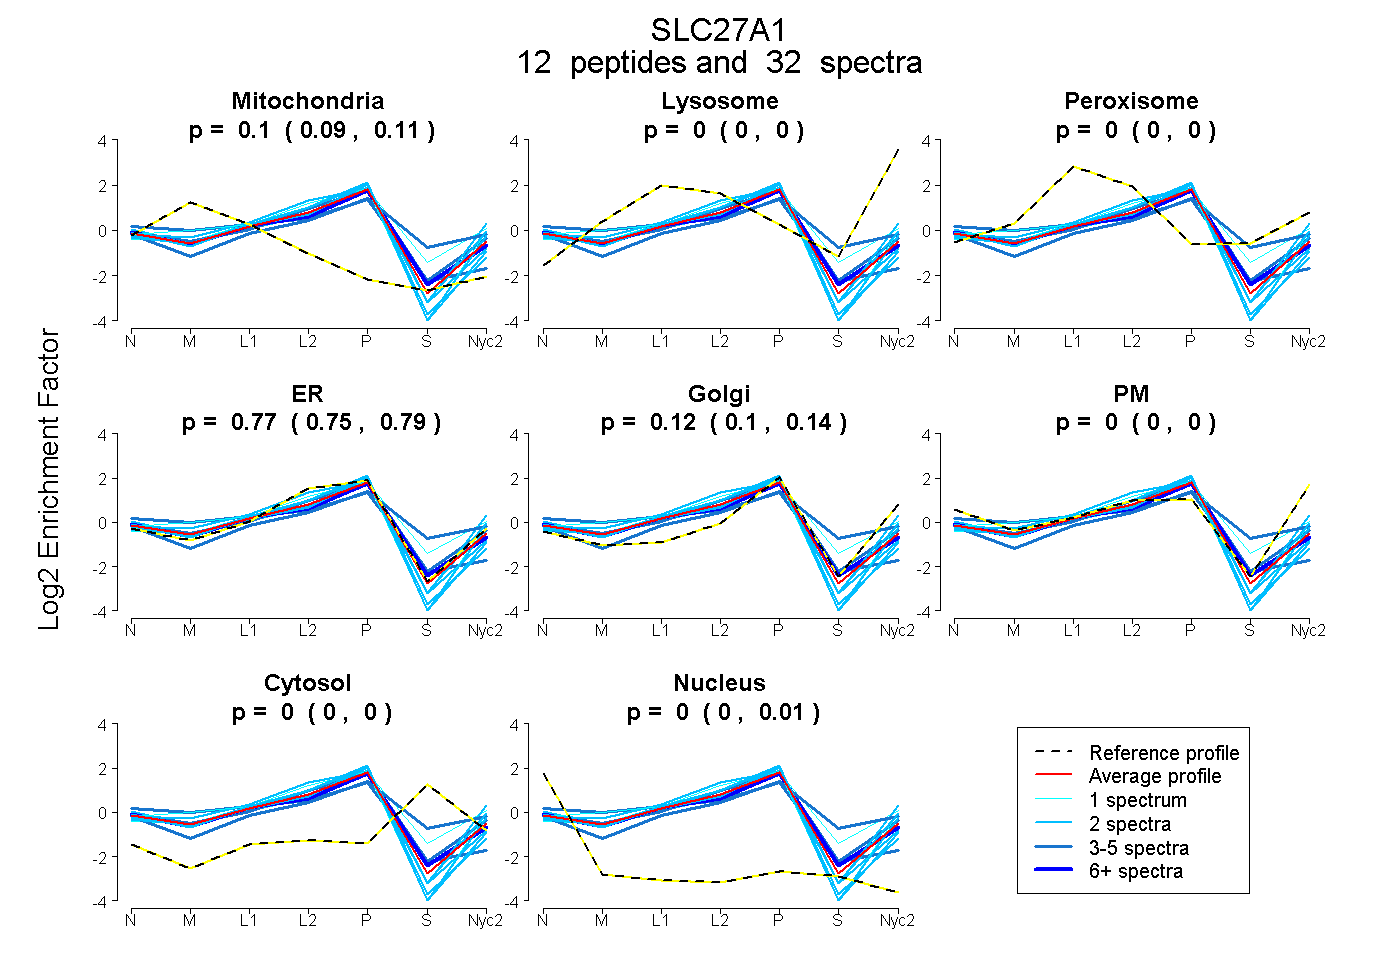
0.093 | 0.105
0.000 | 0.000
0.000 | 0.000
0.752 | 0.789
0.101 | 0.142
0.000 | 0.000
0.000 | 0.000
0.000 | 0.010
5peptides
spectra
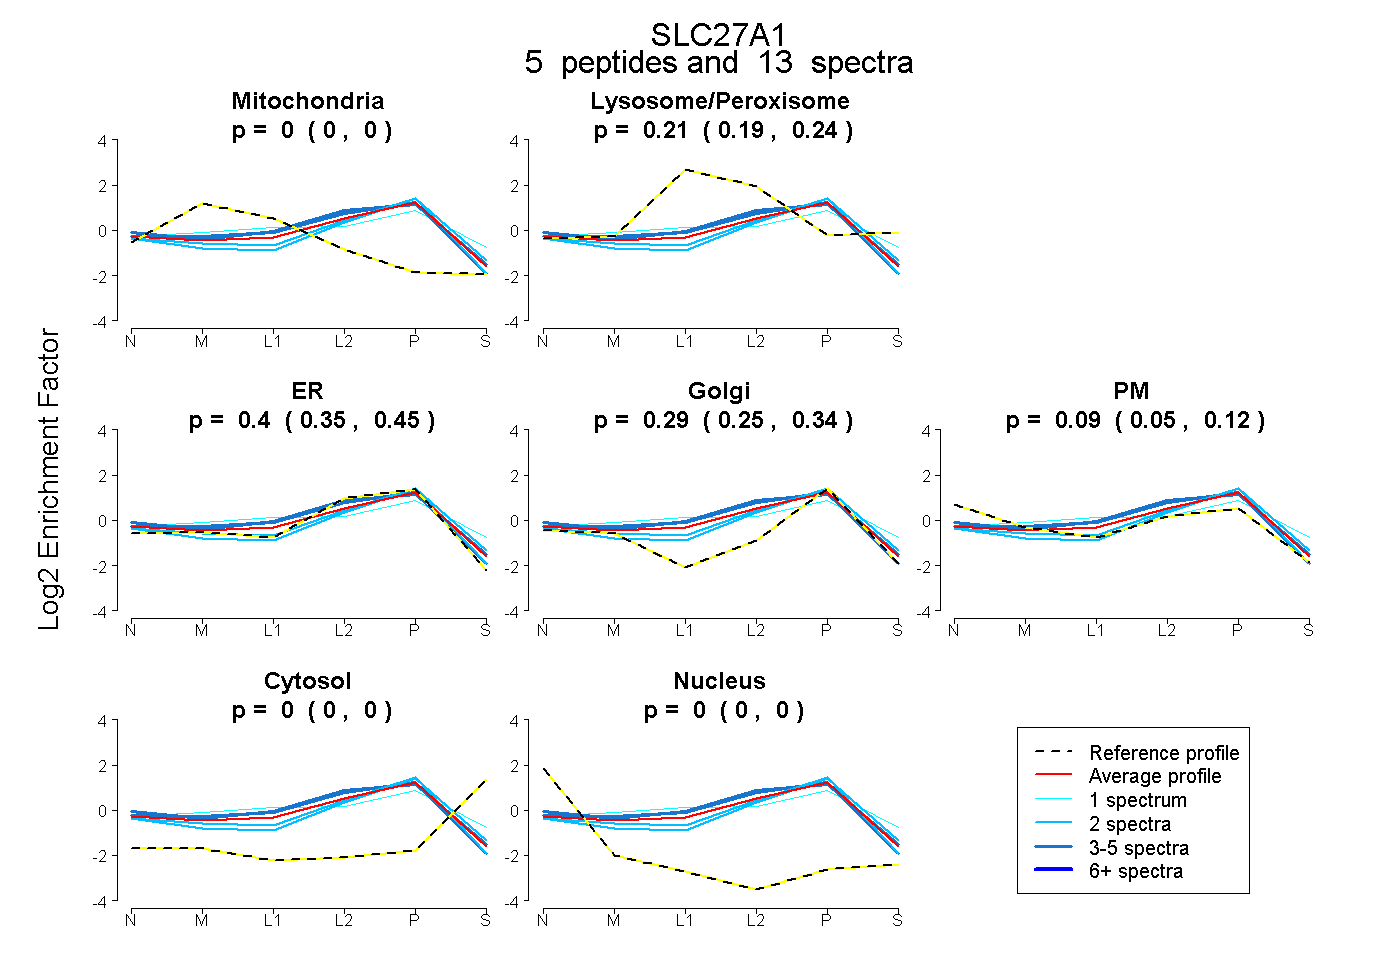
0.000 | 0.000
0.186 | 0.238
0.348 | 0.447
0.246 | 0.338
0.054 | 0.116
0.000 | 0.000
0.000 | 0.000
11peptides
spectra
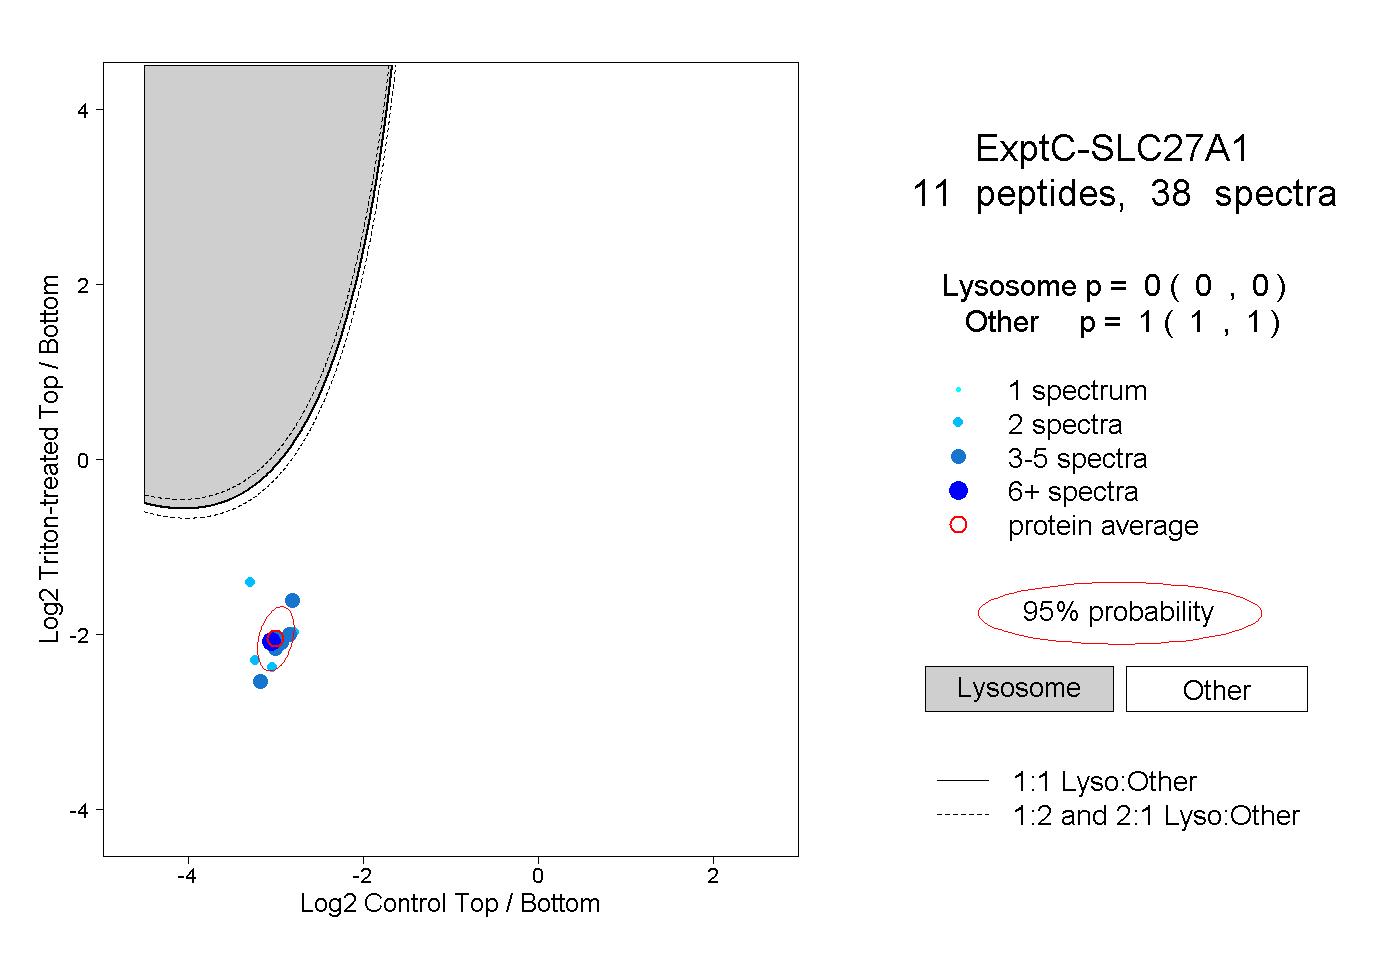
0.000 | 0.000
1.000 | 1.000
3peptides
spectra
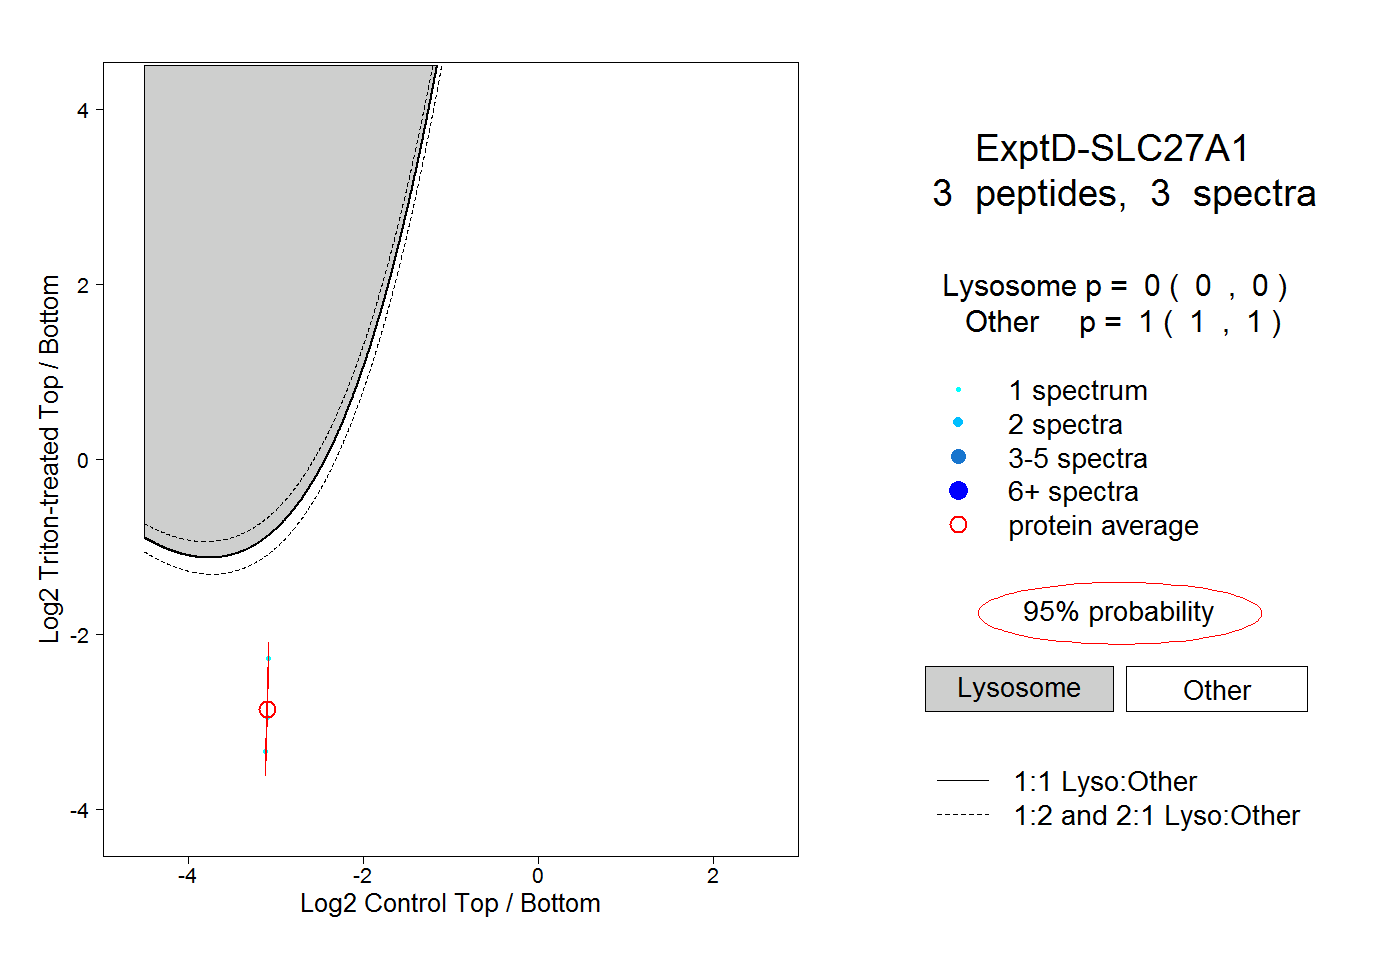
0.000 | 0.000
1.000 | 1.000