SLC27A1
[ENSRNOP00000024659]
Main page
| | | Plot |
Mito |
Lyso |
|
Perox |
ER |
Golgi |
PM |
Cytosol |
Nucleus |
|
| Expt A |
 12
12
peptides |
32
spectra |
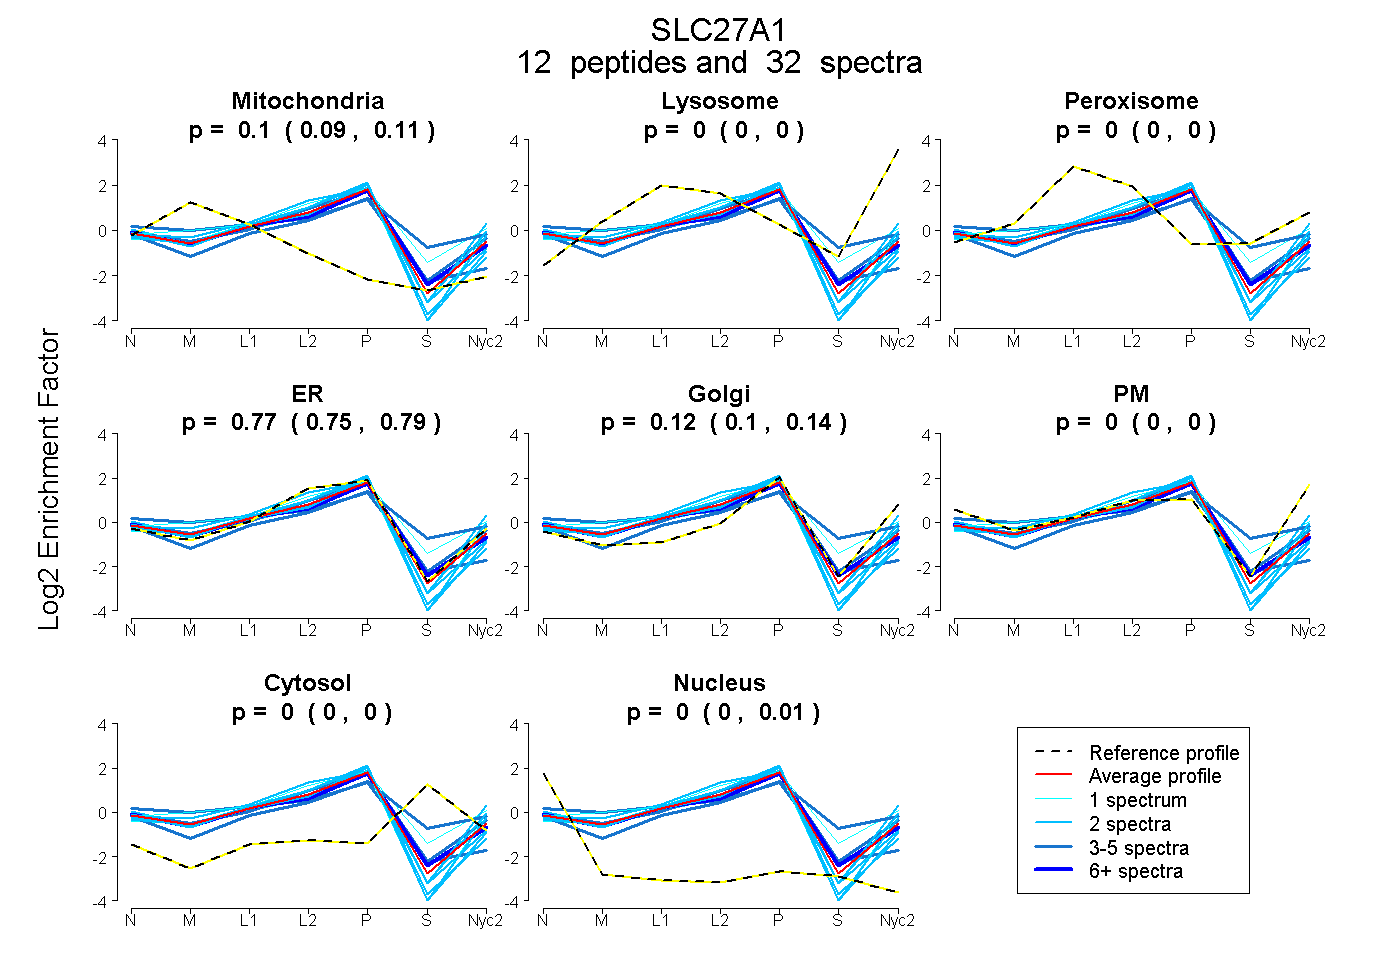 |
0.100
0.093 | 0.105 |
0.000
0.000 | 0.000 |
|
0.000
0.000 | 0.000 |
0.772
0.752 | 0.789 |
0.123
0.101 | 0.142 |
0.000
0.000 | 0.000 |
0.000
0.000 | 0.000 |
0.004
0.000 | 0.010 |
|
| | | Plot |
Mito |
|
Lyso or Perox |
|
ER |
Golgi |
PM |
Cytosol |
Nucleus |
|
| Expt B |
5
peptides |
13
spectra |
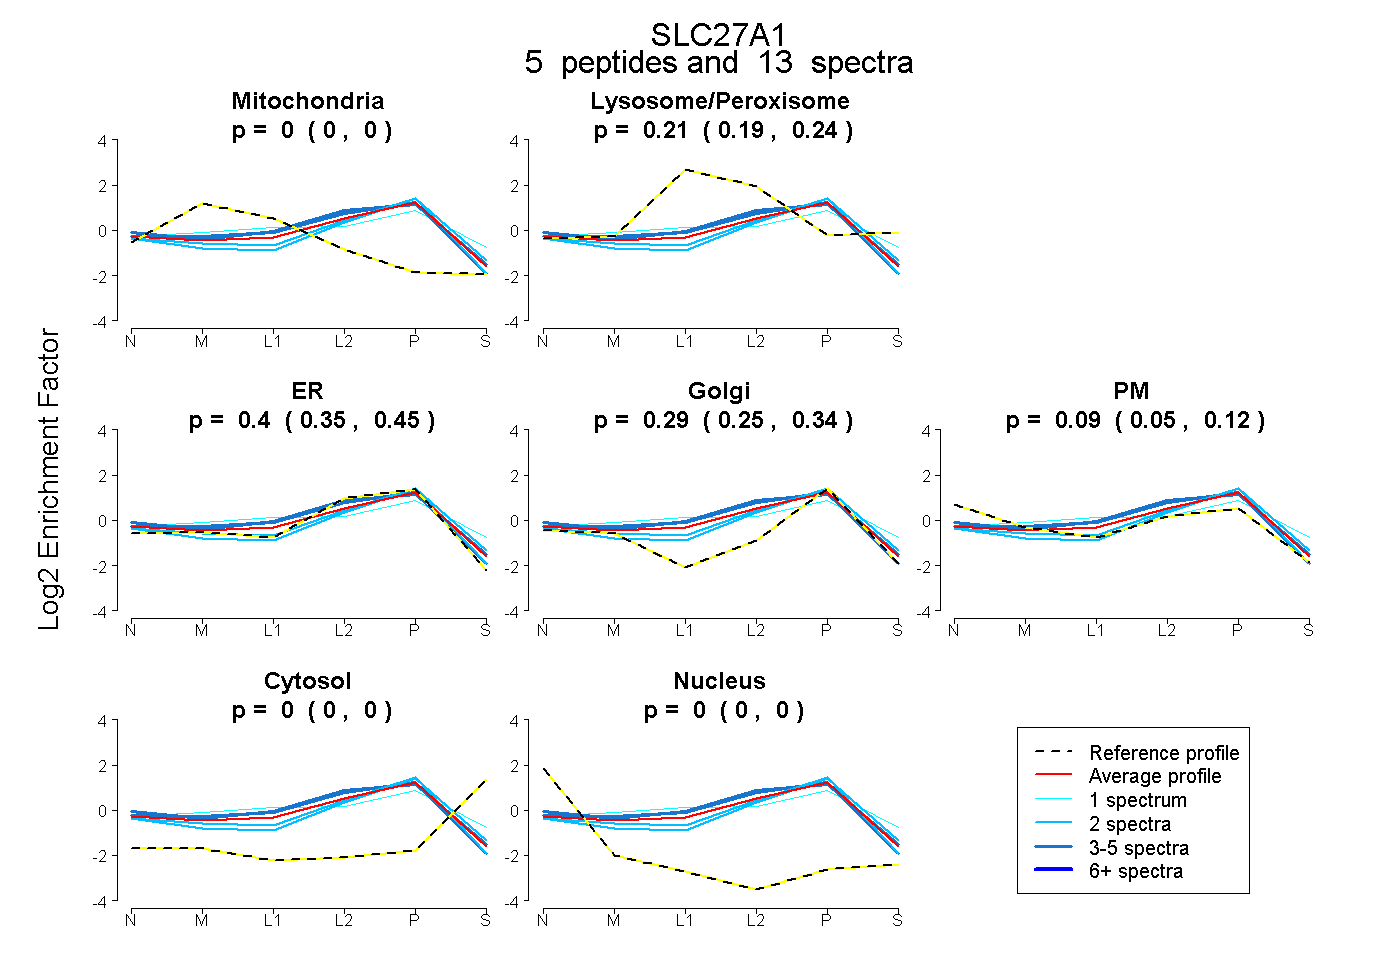 |
0.000
0.000 | 0.000 |
|
0.214
0.186 | 0.238 |
|
0.403
0.348 | 0.447 |
0.294
0.246 | 0.338 |
0.088
0.054 | 0.116 |
0.000
0.000 | 0.000 |
0.000
0.000 | 0.000 |
|
| 2 spectra, YLPLDER |
0.000 |
|
0.176 |
|
0.326 |
0.484 |
0.000 |
0.014 |
0.000 |
|
| 1 spectrum, AAIVVHSR |
0.001 |
|
0.447 |
|
0.000 |
0.543 |
0.000 |
0.009 |
0.000 |
|
| 4 spectra, ILTHVYPIR |
0.000 |
|
0.229 |
|
0.464 |
0.089 |
0.219 |
0.000 |
0.000 |
|
| 4 spectra, IFQAVAQR |
0.000 |
|
0.154 |
|
0.635 |
0.039 |
0.172 |
0.000 |
0.000 |
|
| 2 spectra, LFFLDLK |
0.000 |
|
0.101 |
|
0.580 |
0.292 |
0.027 |
0.000 |
0.000 |
|
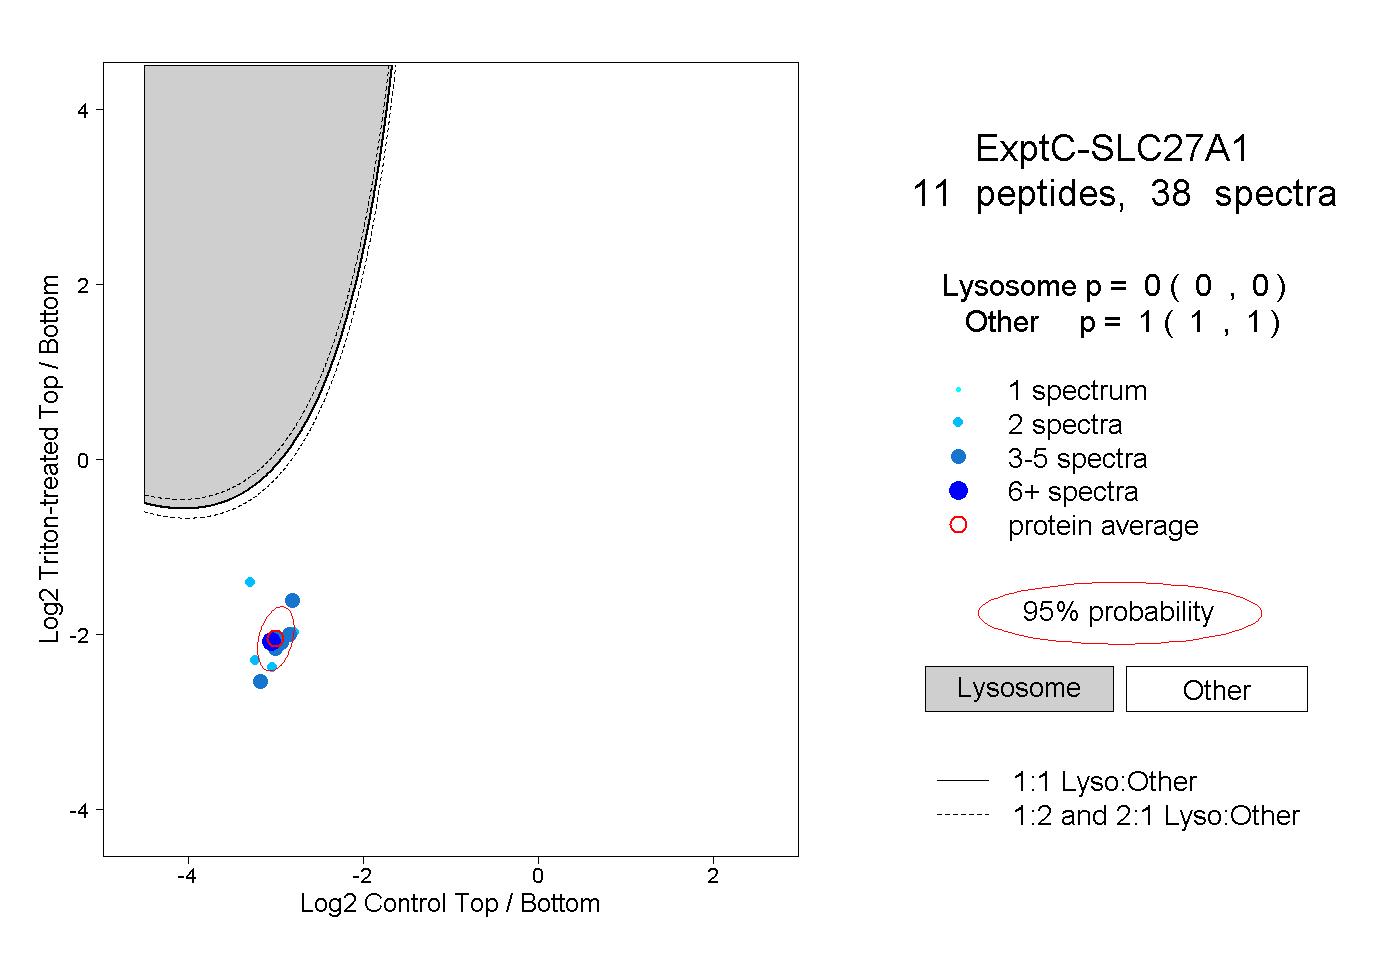
| | | Plot |
|
Lyso |
|
|
|
|
|
|
|
Other |
| Expt C |
11
peptides |
38
spectra |
 |
|
0.000
0.000 | 0.000 |
|
|
|
|
|
|
|
1.000
1.000 | 1.000 |
| | | Plot |
|
Lyso |
|
|
|
|
|
|
|
Other |
| Expt D |
3
peptides |
3
spectra |
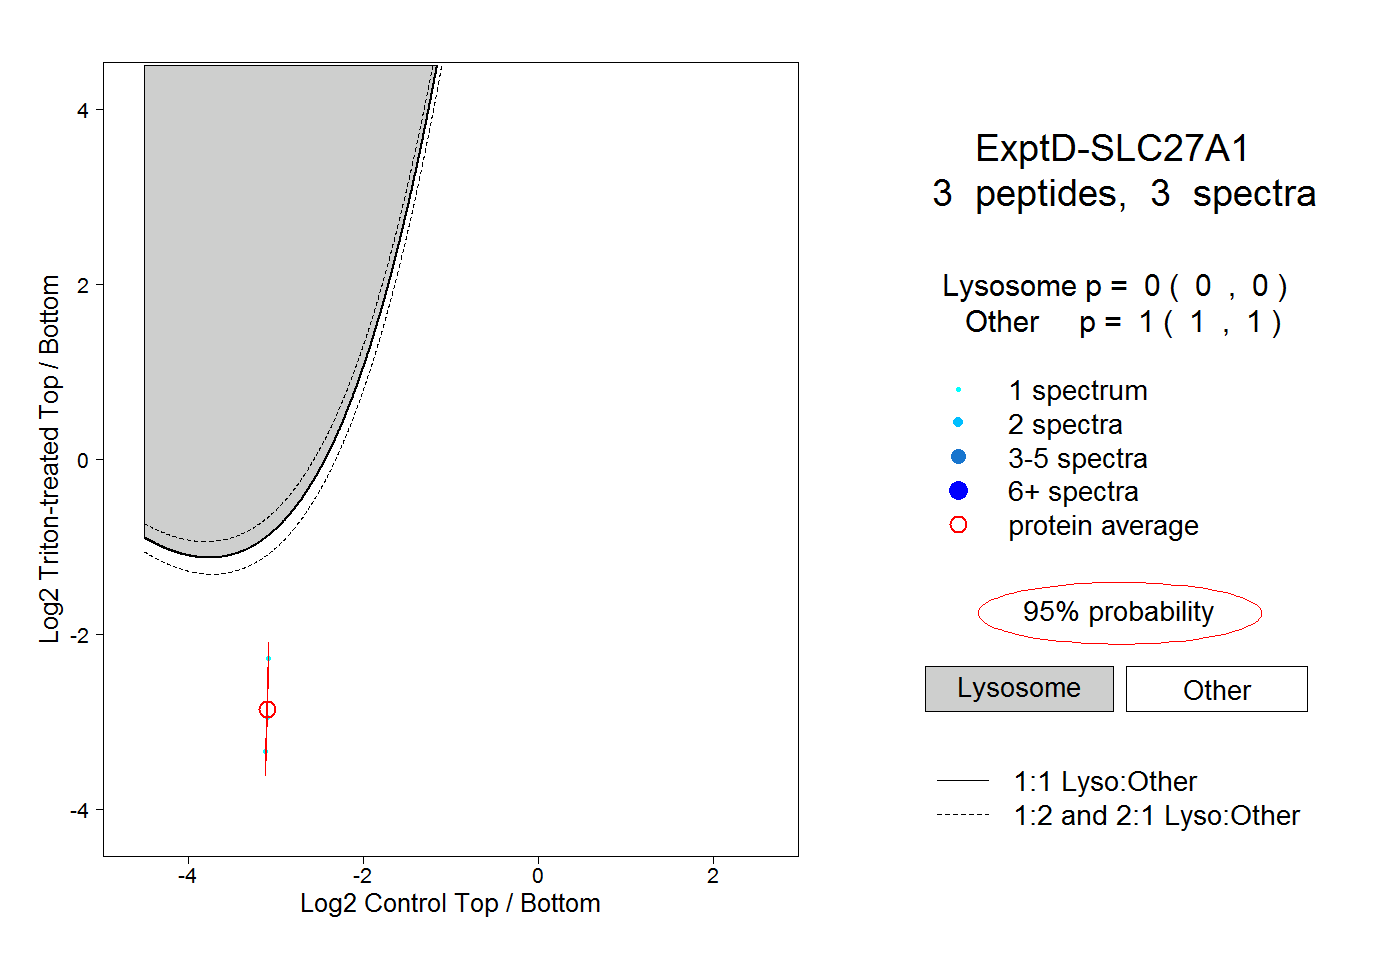 |
|
0.000
0.000 | 0.000 |
|
|
|
|
|
|
|
1.000
1.000 | 1.000 |