 12
12peptides
spectra
0.093 | 0.105
0.000 | 0.000
0.000 | 0.000
0.752 | 0.789
0.101 | 0.142
0.000 | 0.000
0.000 | 0.000
0.000 | 0.010
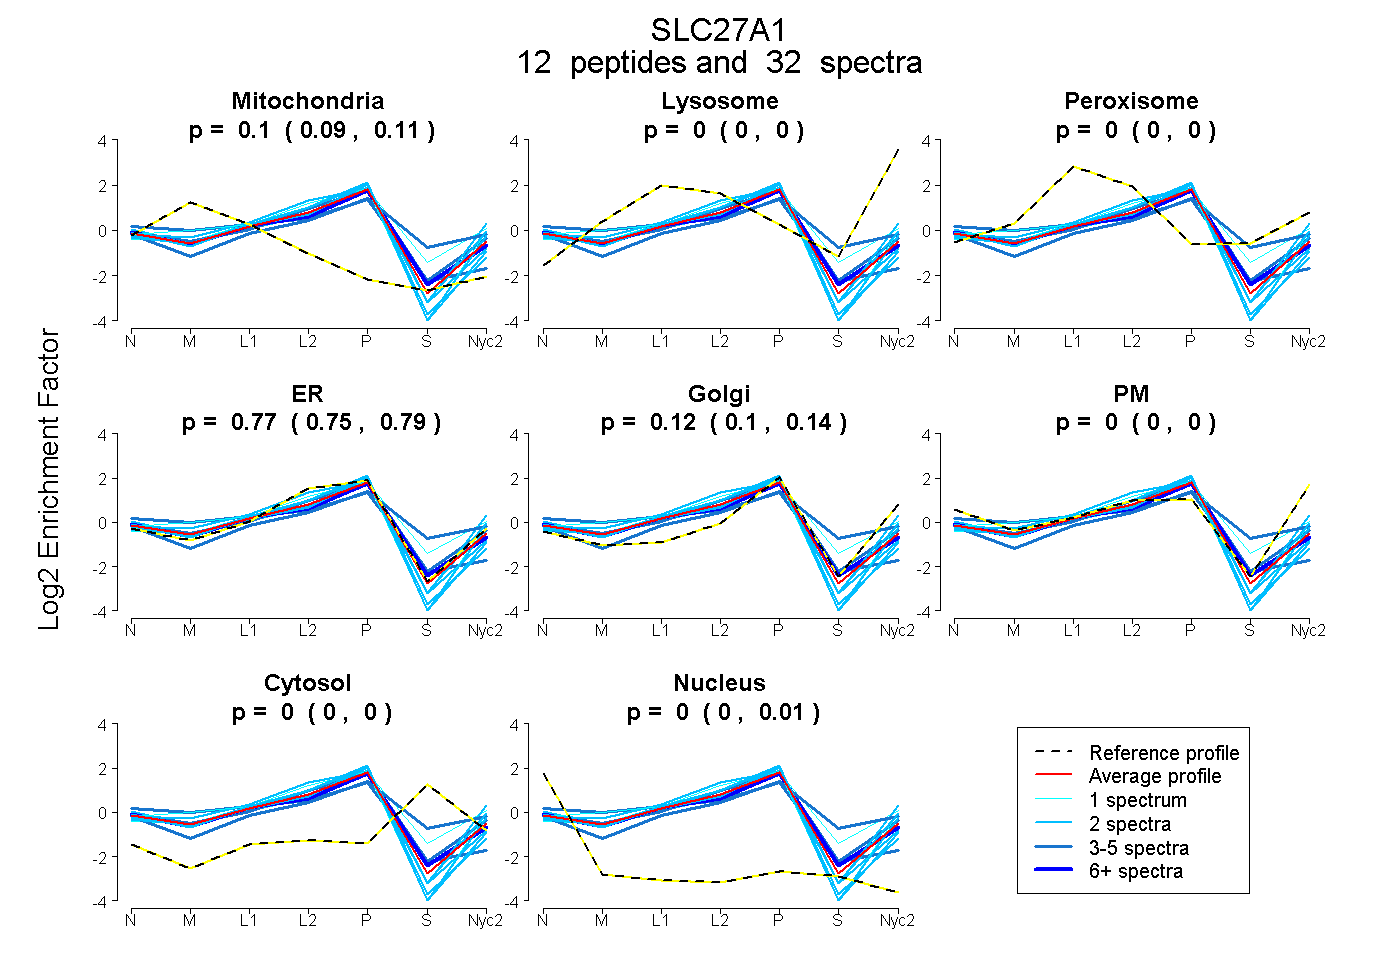
| Plot | Mito | Lyso | Perox | ER | Golgi | PM | Cytosol | Nucleus | |||||
| Expt A |
12 peptides |
32 spectra |
|
0.100 0.093 | 0.105 |
0.000 0.000 | 0.000 |
0.000 0.000 | 0.000 |
0.772 0.752 | 0.789 |
0.123 0.101 | 0.142 |
0.000 0.000 | 0.000 |
0.000 0.000 | 0.000 |
0.004 0.000 | 0.010 |
| 2 spectra, YLPLDER | 0.045 | 0.000 | 0.000 | 0.889 | 0.000 | 0.000 | 0.000 | 0.065 | ||
| 2 spectra, VLASYAQPIFLR | 0.051 | 0.000 | 0.000 | 0.918 | 0.000 | 0.000 | 0.000 | 0.031 | ||
| 3 spectra, FWDDCVK | 0.108 | 0.000 | 0.000 | 0.829 | 0.000 | 0.000 | 0.000 | 0.063 | ||
| 2 spectra, EGFDPR | 0.059 | 0.000 | 0.000 | 0.853 | 0.030 | 0.000 | 0.000 | 0.058 | ||
| 2 spectra, IFQAVAQR | 0.008 | 0.011 | 0.000 | 0.743 | 0.000 | 0.237 | 0.000 | 0.000 | ||
| 3 spectra, GENVSTTEVEAVLSR | 0.187 | 0.000 | 0.053 | 0.499 | 0.174 | 0.087 | 0.000 | 0.000 | ||
| 9 spectra, IAHSVFR | 0.104 | 0.000 | 0.007 | 0.737 | 0.128 | 0.000 | 0.000 | 0.024 | ||
| 2 spectra, VNEDTMEPLR | 0.051 | 0.000 | 0.000 | 0.679 | 0.258 | 0.011 | 0.000 | 0.000 | ||
| 1 spectrum, ALIYGGEMAAAVAEVSEQLGK | 0.000 | 0.000 | 0.198 | 0.347 | 0.393 | 0.000 | 0.062 | 0.000 | ||
| 2 spectra, LFFLDLK | 0.029 | 0.000 | 0.000 | 0.873 | 0.098 | 0.000 | 0.000 | 0.000 | ||
| 1 spectrum, LAVGNGLRPAIWEEFTQR | 0.071 | 0.000 | 0.000 | 0.812 | 0.000 | 0.117 | 0.000 | 0.000 | ||
| 3 spectra, ILTHVYPIR | 0.000 | 0.000 | 0.097 | 0.428 | 0.212 | 0.000 | 0.262 | 0.000 |
| Plot | Mito | Lyso or Perox | ER | Golgi | PM | Cytosol | Nucleus | ||||||
| Expt B |
5 peptides |
13 spectra |
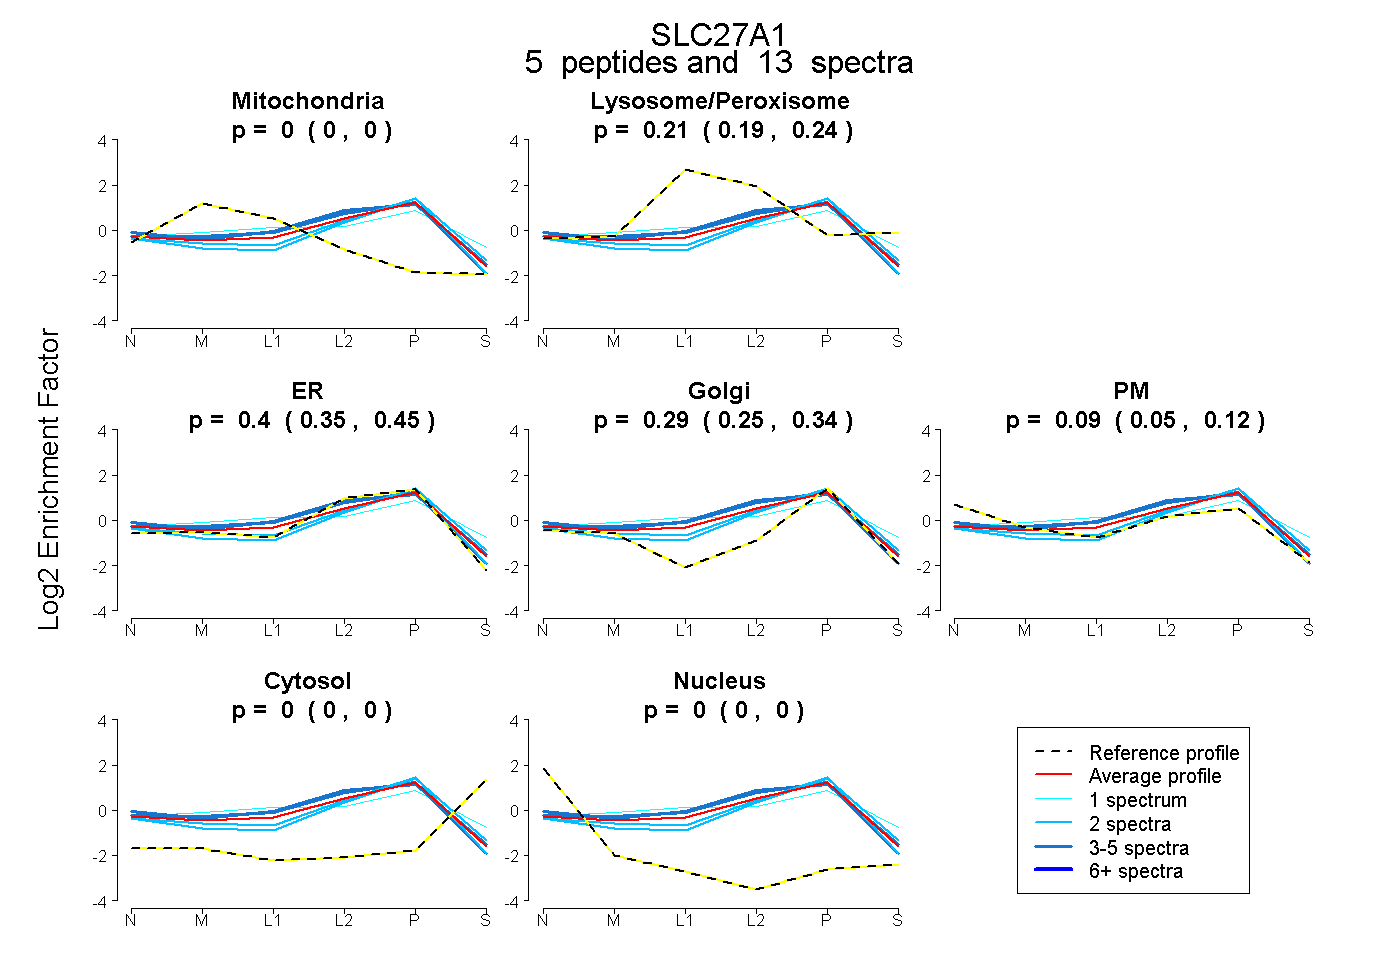 |
0.000 0.000 | 0.000 |
0.214 0.186 | 0.238 |
0.403 0.348 | 0.447 |
0.294 0.246 | 0.338 |
0.088 0.054 | 0.116 |
0.000 0.000 | 0.000 |
0.000 0.000 | 0.000 |
|||
| Plot | Lyso | Other | |||||||||||
| Expt C |
11 peptides |
38 spectra |
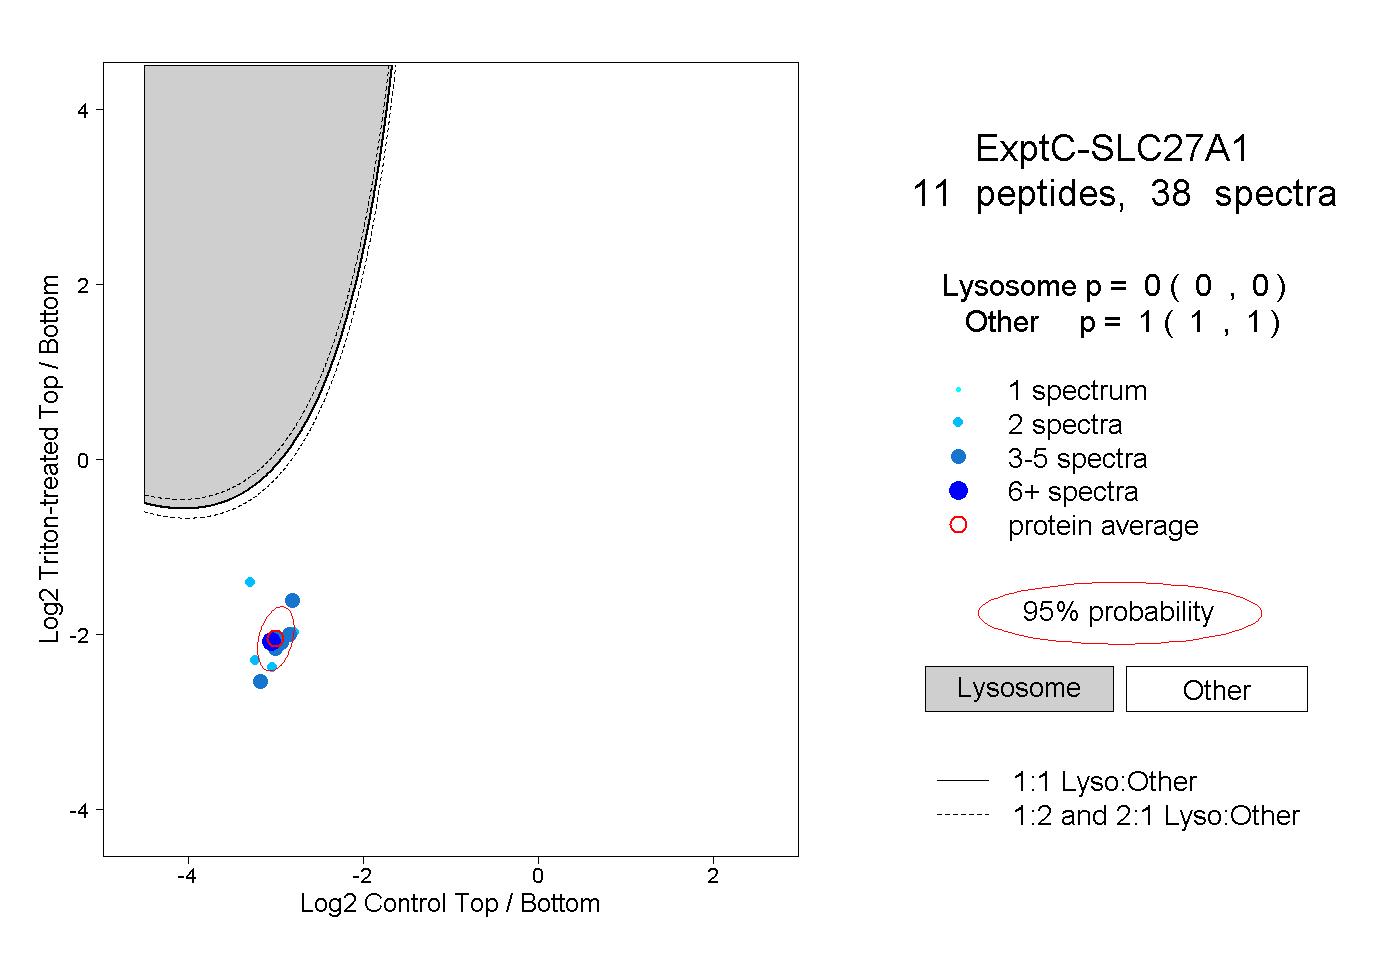 |
0.000 0.000 | 0.000 |
1.000 1.000 | 1.000 |
||||||||
| Plot | Lyso | Other | |||||||||||
| Expt D |
3 peptides |
3 spectra |
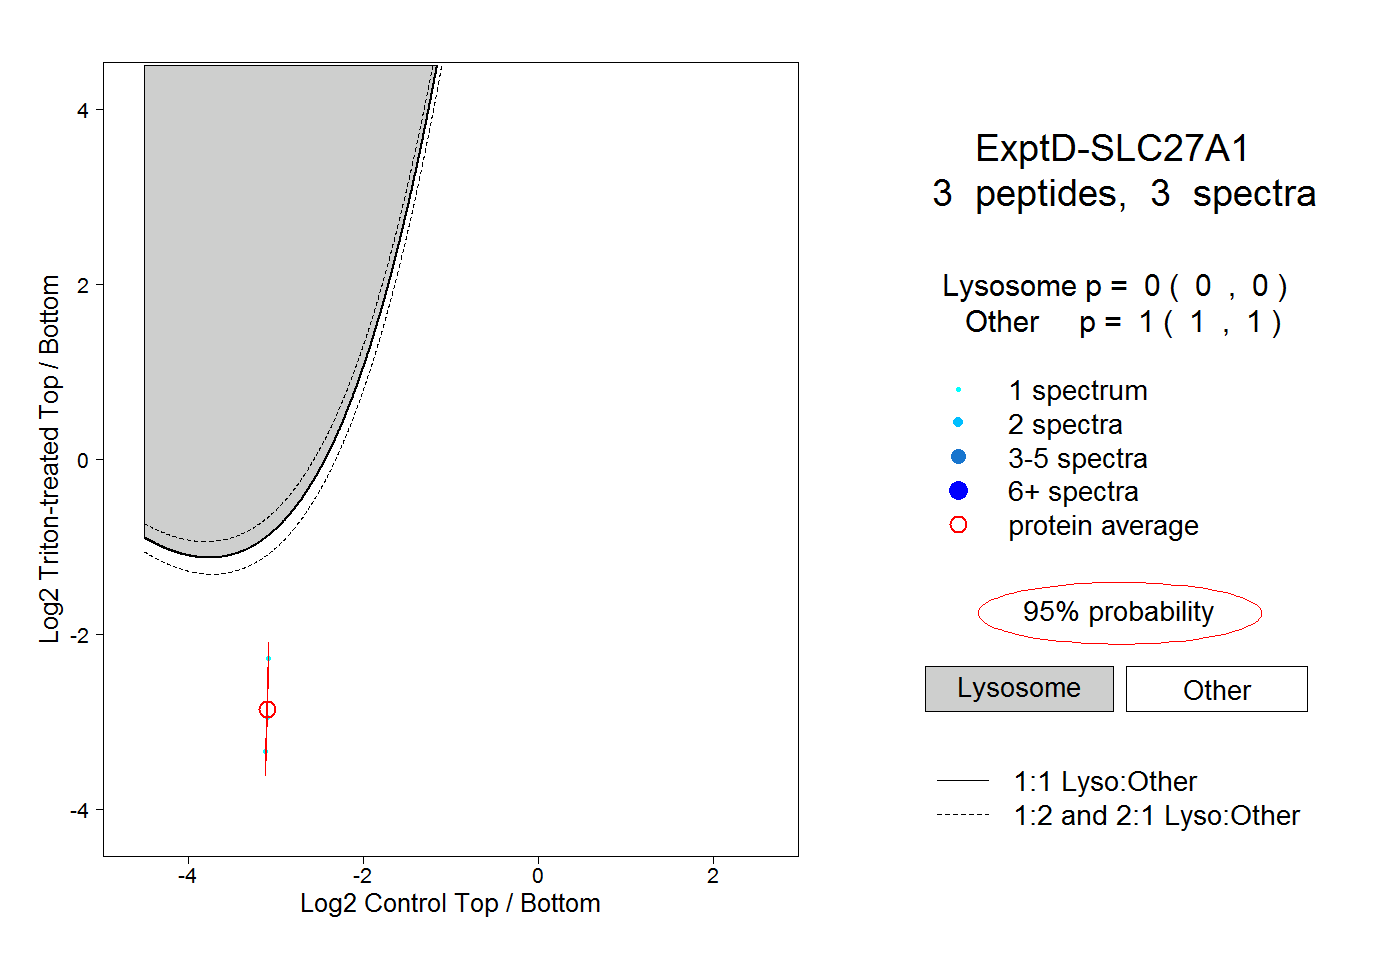 |
0.000 0.000 | 0.000 |
1.000 1.000 | 1.000 |