 4
4peptides
spectra
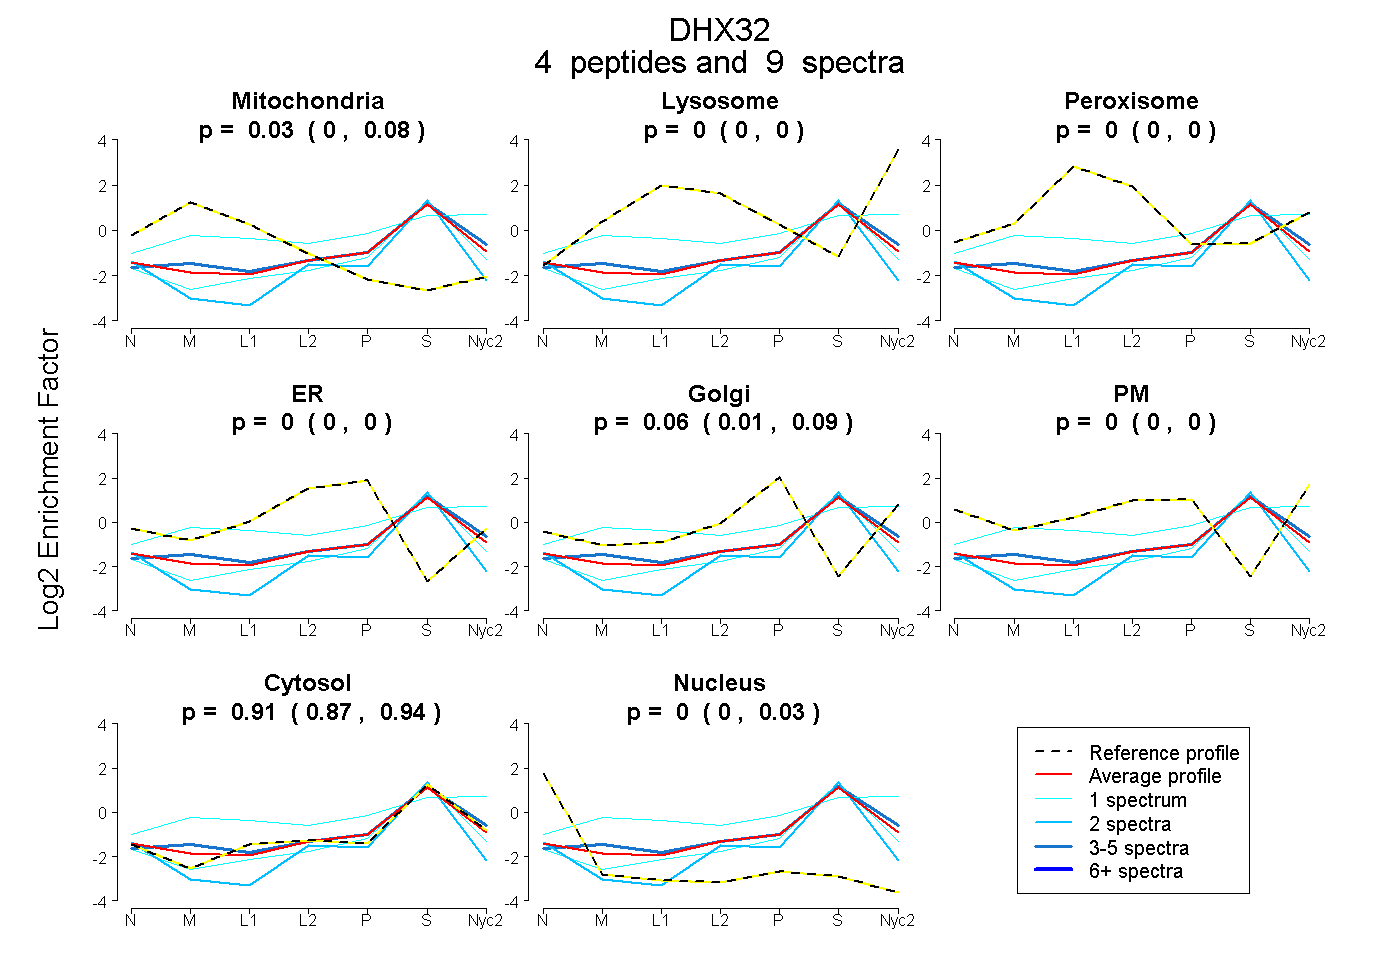
0.000 | 0.077
0.000 | 0.000
0.000 | 0.000
0.000 | 0.000
0.012 | 0.091
0.000 | 0.000
0.867 | 0.935
0.000 | 0.034
| Plot | Mito | Lyso | Perox | ER | Golgi | PM | Cytosol | Nucleus | |||||
| Expt A |
4 peptides |
9 spectra |
|
0.026 0.000 | 0.077 |
0.000 0.000 | 0.000 |
0.000 0.000 | 0.000 |
0.000 0.000 | 0.000 |
0.057 0.012 | 0.091 |
0.000 0.000 | 0.000 |
0.913 0.867 | 0.935 |
0.003 0.000 | 0.034 |
| 1 spectrum, AELLEIIK | 0.000 | 0.000 | 0.000 | 0.000 | 0.000 | 0.000 | 0.954 | 0.046 | ||
| 5 spectra, LIFEIHR | 0.046 | 0.018 | 0.000 | 0.000 | 0.055 | 0.000 | 0.881 | 0.000 | ||
| 2 spectra, LIINCSPFLISR | 0.000 | 0.000 | 0.000 | 0.000 | 0.000 | 0.000 | 0.823 | 0.177 | ||
| 1 spectrum, SLATDVLLGLLK | 0.074 | 0.330 | 0.000 | 0.000 | 0.080 | 0.000 | 0.517 | 0.000 |
| Plot | Lyso | Other | |||||||||||
| Expt C |
2 peptides |
2 spectra |
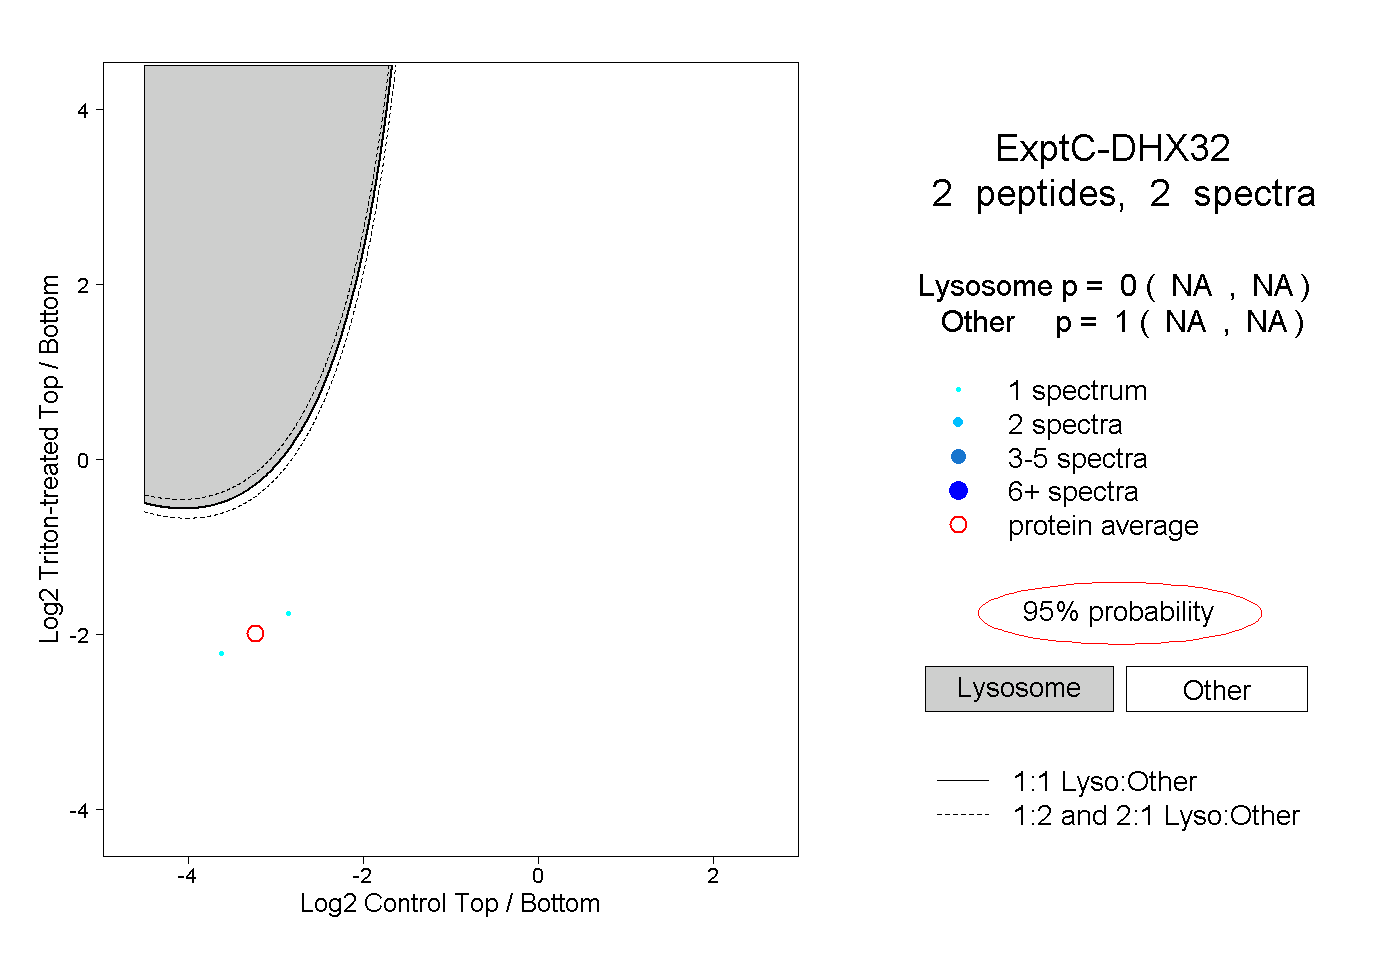 |
0.000 NA | NA |
1.000 NA | NA |