 21
21peptides
spectra
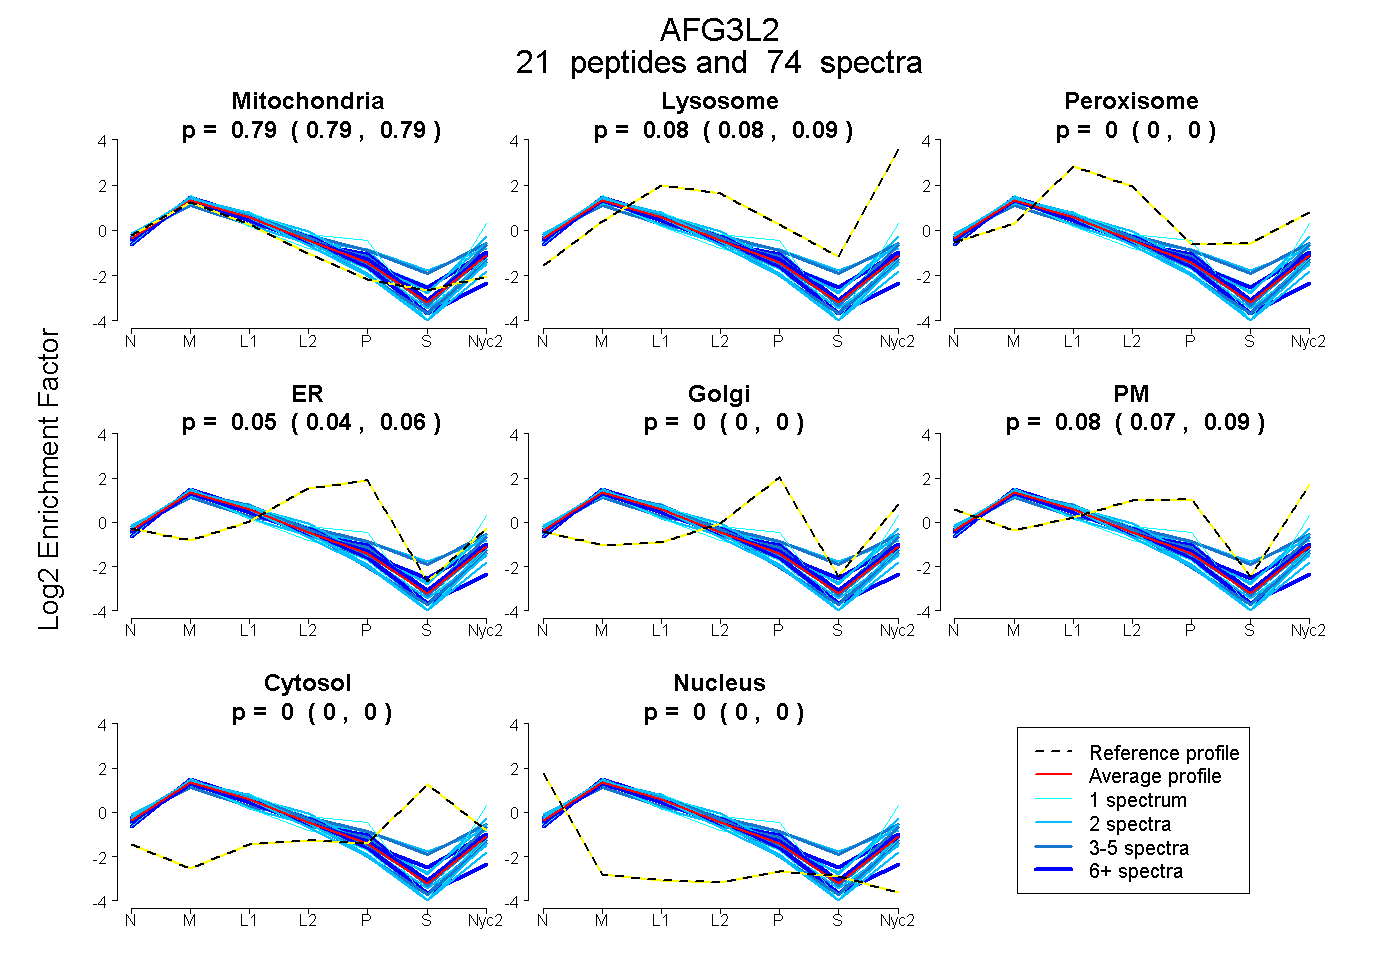
0.785 | 0.792
0.079 | 0.087
0.000 | 0.000
0.041 | 0.056
0.000 | 0.000
0.071 | 0.087
0.000 | 0.000
0.000 | 0.000
12peptides
spectra
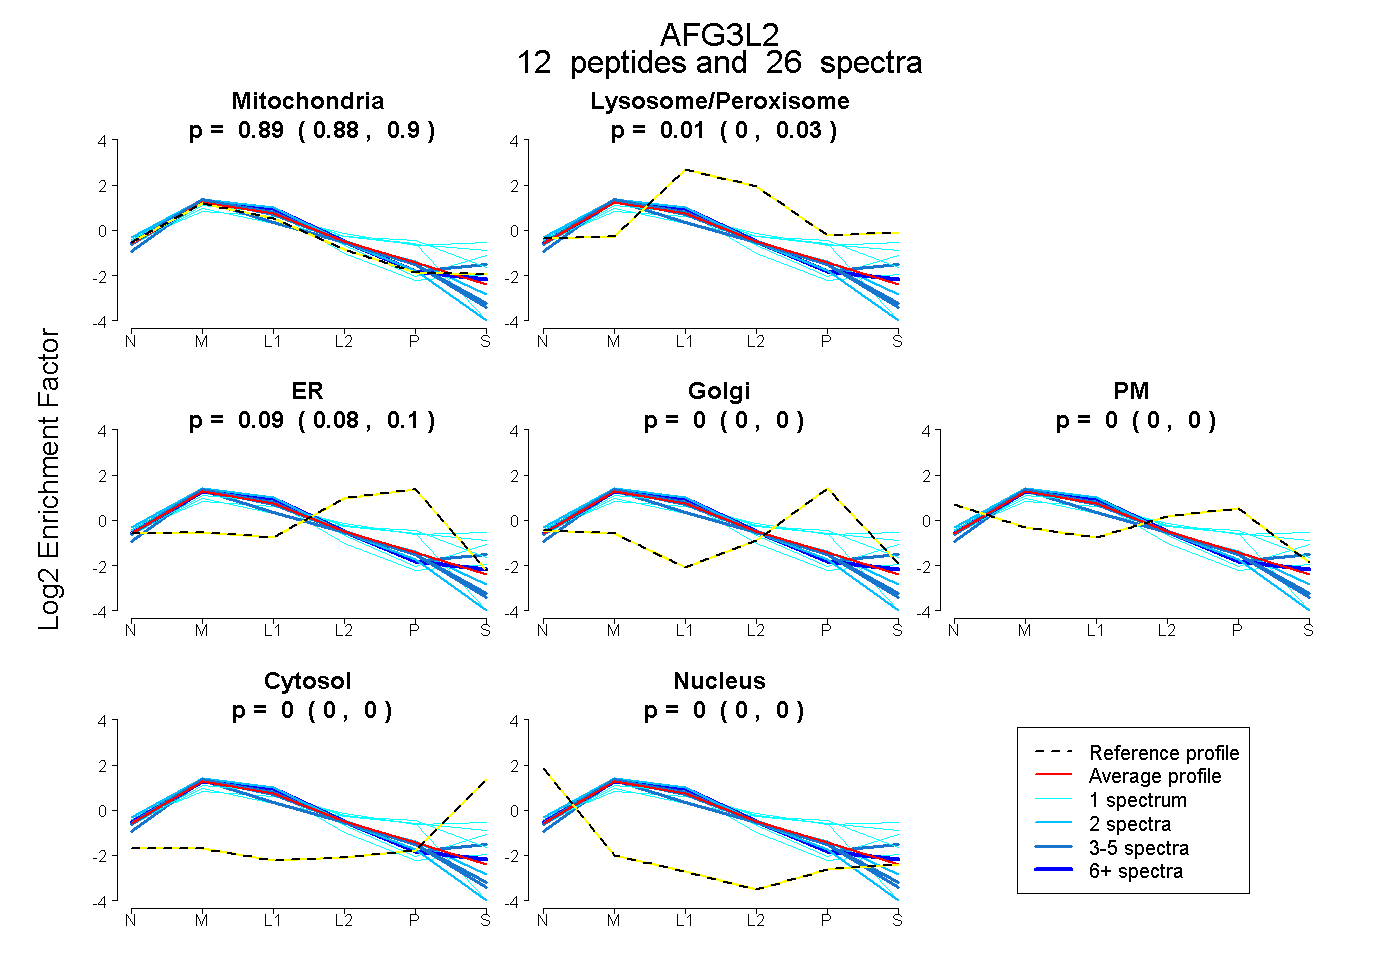
0.881 | 0.904
0.000 | 0.027
0.076 | 0.104
0.000 | 0.000
0.000 | 0.000
0.000 | 0.000
0.000 | 0.000
35peptides
spectra
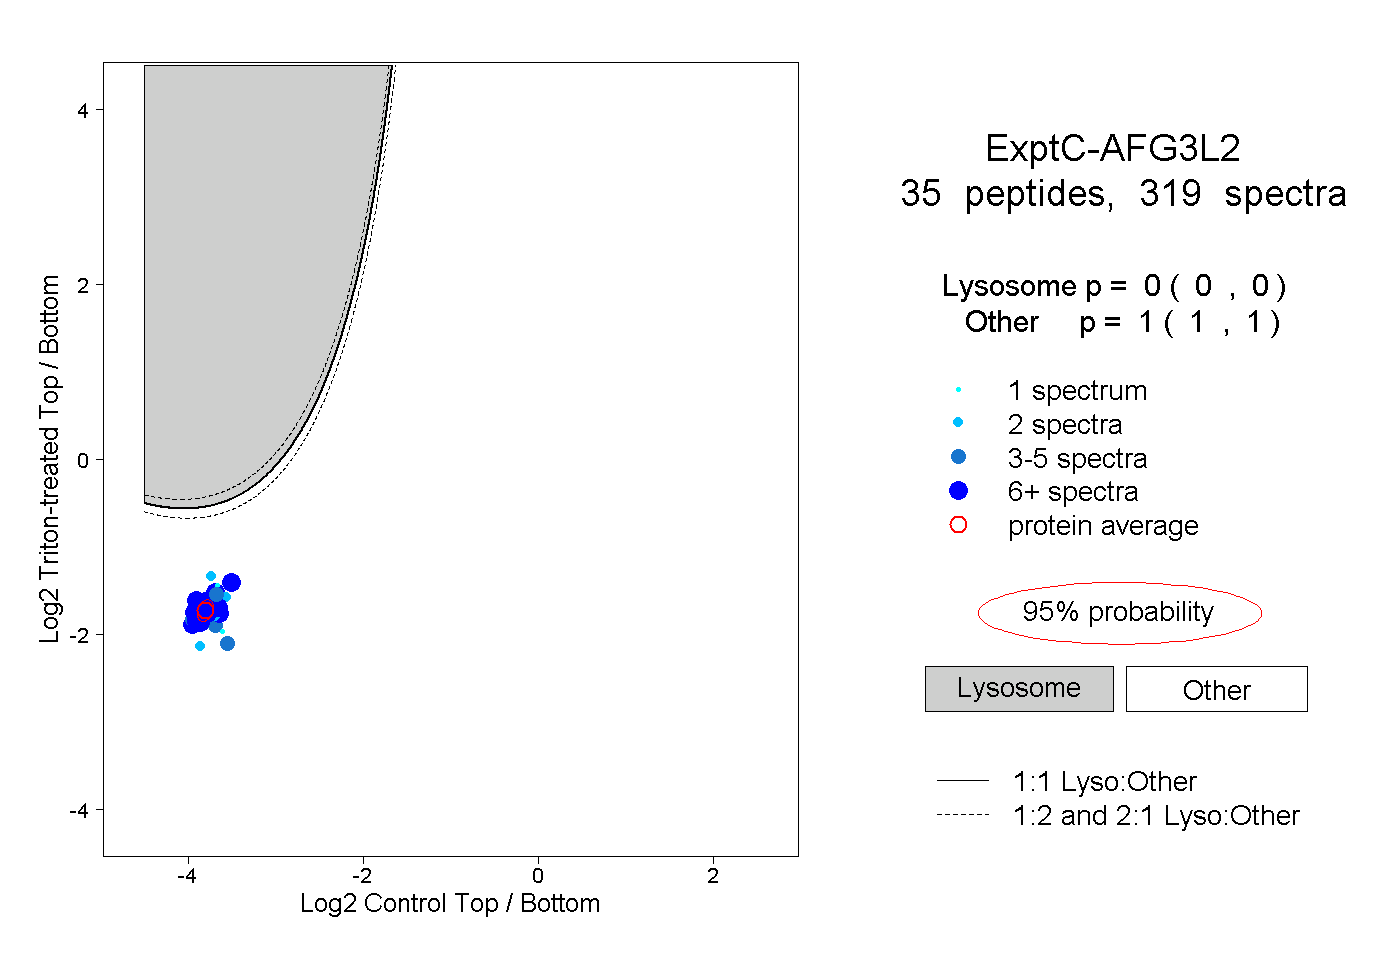
0.000 | 0.000
1.000 | 1.000
12peptides
spectra
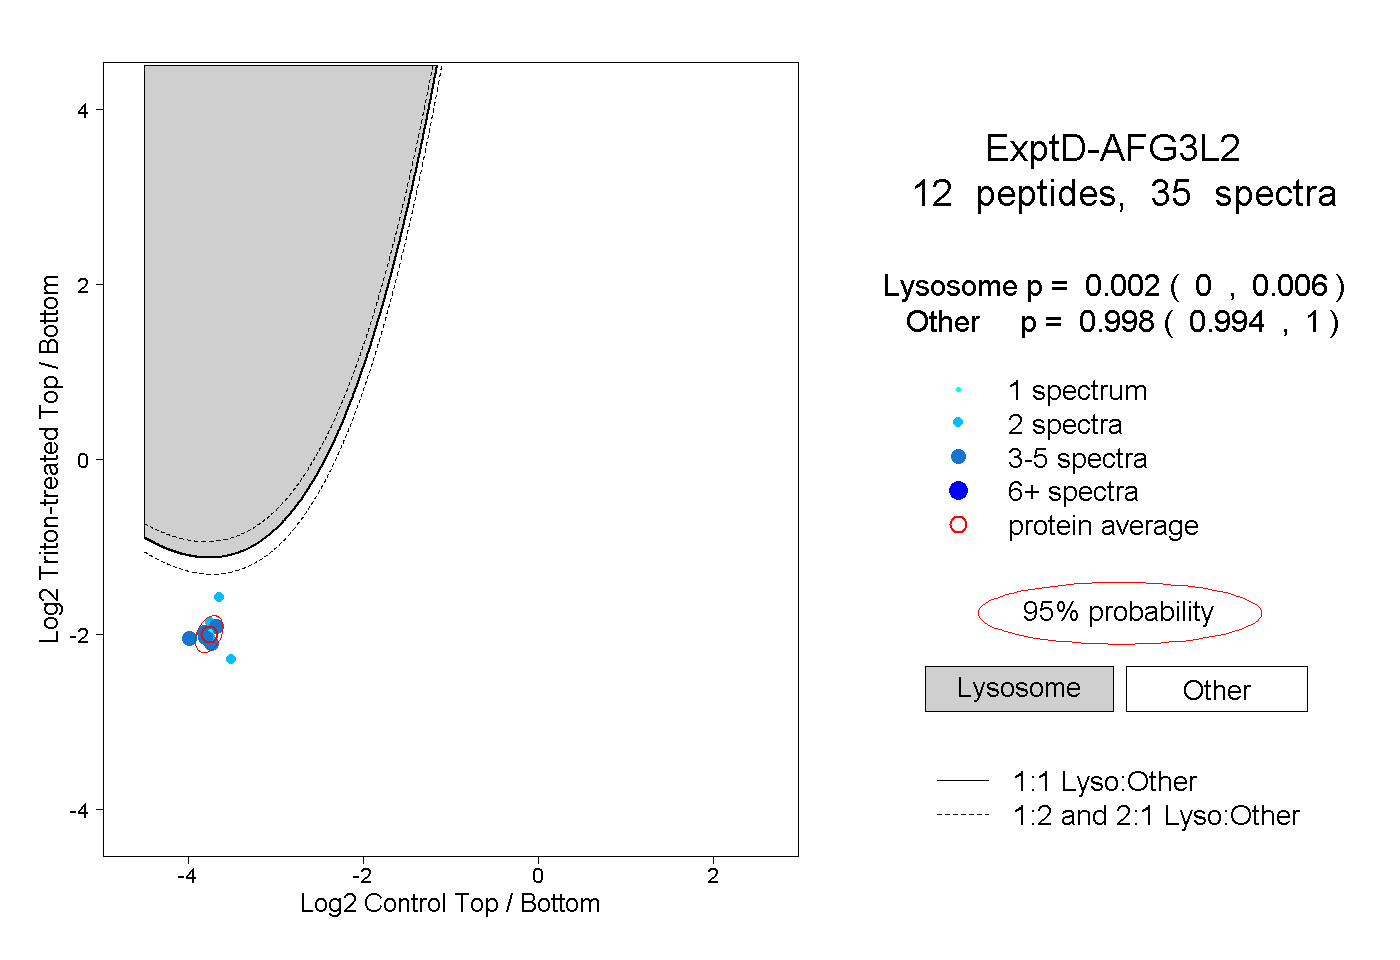
0.000 | 0.006
0.994 | 1.000