 3
3peptides
spectra
0.000 | 0.000
0.000 | 0.087
0.000 | 0.073
0.000 | 0.117
0.000 | 0.077
0.000 | 0.298
0.000 | 0.332
0.484 | 0.755
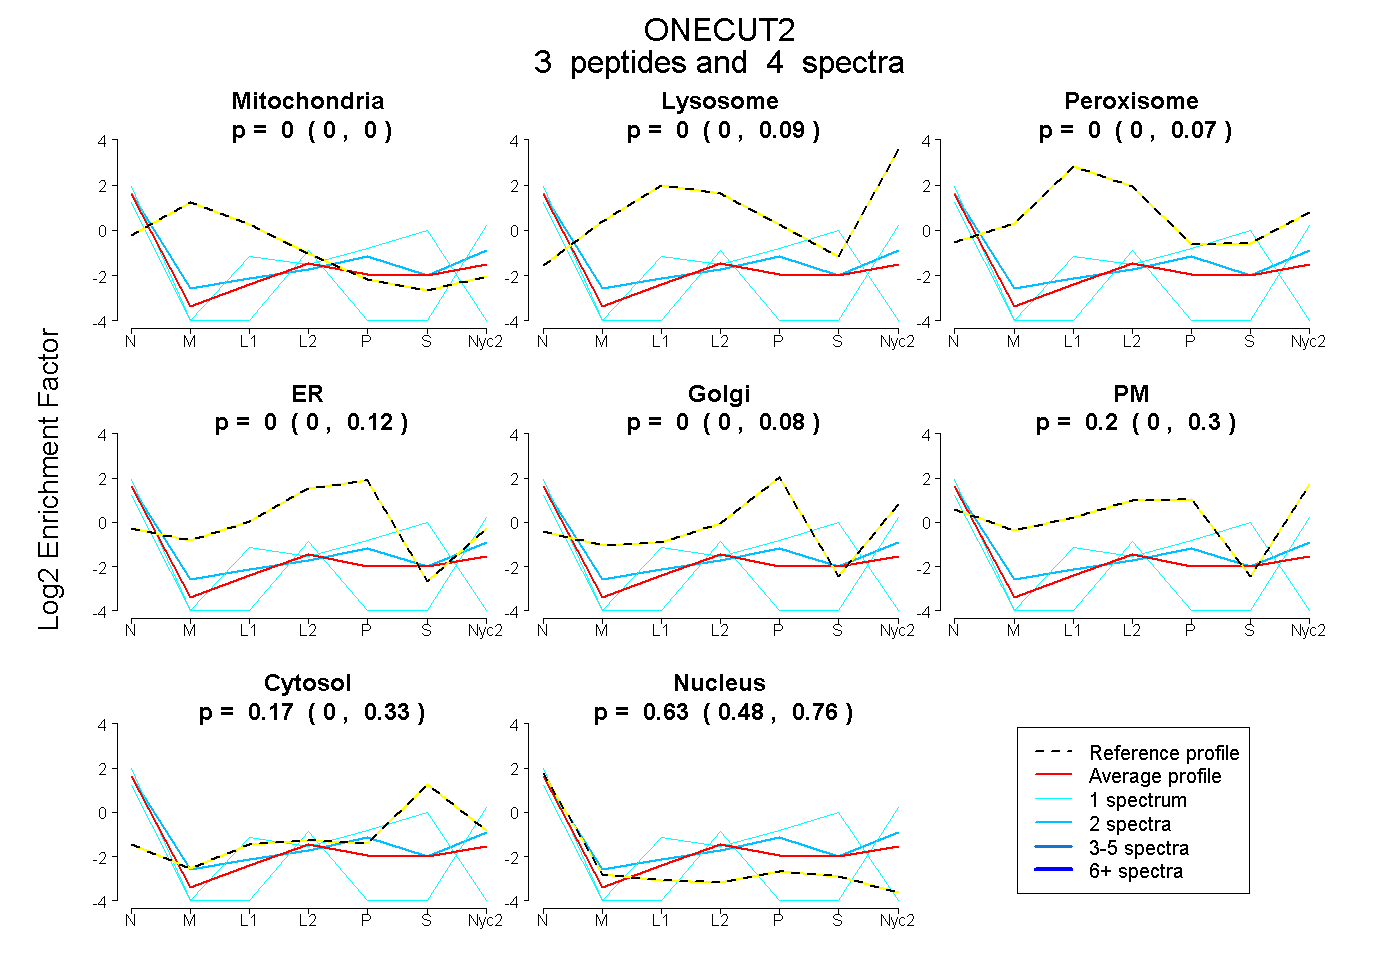
| Plot | Mito | Lyso | Perox | ER | Golgi | PM | Cytosol | Nucleus | |||||
| Expt A |
3 peptides |
4 spectra |
|
0.000 0.000 | 0.000 |
0.000 0.000 | 0.087 |
0.000 0.000 | 0.073 |
0.000 0.000 | 0.117 |
0.000 0.000 | 0.077 |
0.200 0.000 | 0.298 |
0.170 0.000 | 0.332 |
0.629 0.484 | 0.755 |
| 1 spectrum, YSIPQAIFAQR | 0.000 | 0.043 | 0.000 | 0.000 | 0.000 | 0.182 | 0.000 | 0.775 | ||
| 1 spectrum, TLFAIFK | 0.000 | 0.000 | 0.000 | 0.054 | 0.000 | 0.000 | 0.440 | 0.506 | ||
| 2 spectra, SQGTLSDLLR | 0.000 | 0.000 | 0.000 | 0.000 | 0.000 | 0.329 | 0.121 | 0.550 |