 1
1peptide
spectra
0.000 | 0.000
0.000 | 0.000
0.000 | 0.000
0.582 | 0.638
0.000 | 0.053
0.000 | 0.000
0.337 | 0.362
0.000 | 0.030
1peptide
spectra
NA | NA
NA | NA
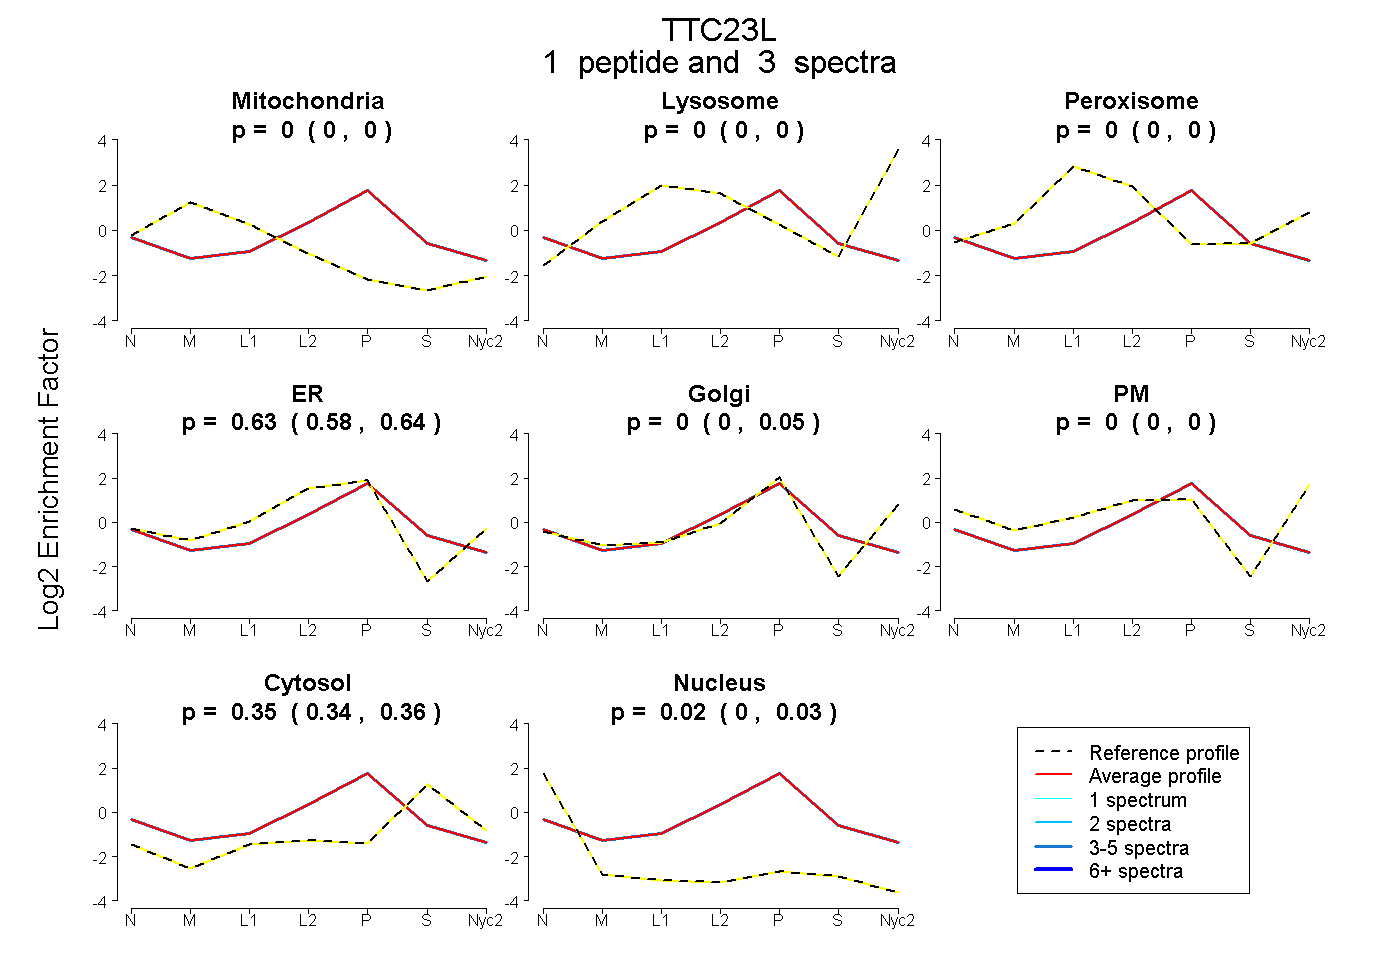
| Plot | Mito | Lyso | Perox | ER | Golgi | PM | Cytosol | Nucleus | |||||
| Expt A |
1 peptide |
3 spectra |
|
0.000 0.000 | 0.000 |
0.000 0.000 | 0.000 |
0.000 0.000 | 0.000 |
0.633 0.582 | 0.638 |
0.000 0.000 | 0.053 |
0.000 0.000 | 0.000 |
0.352 0.337 | 0.362 |
0.016 0.000 | 0.030 |
||
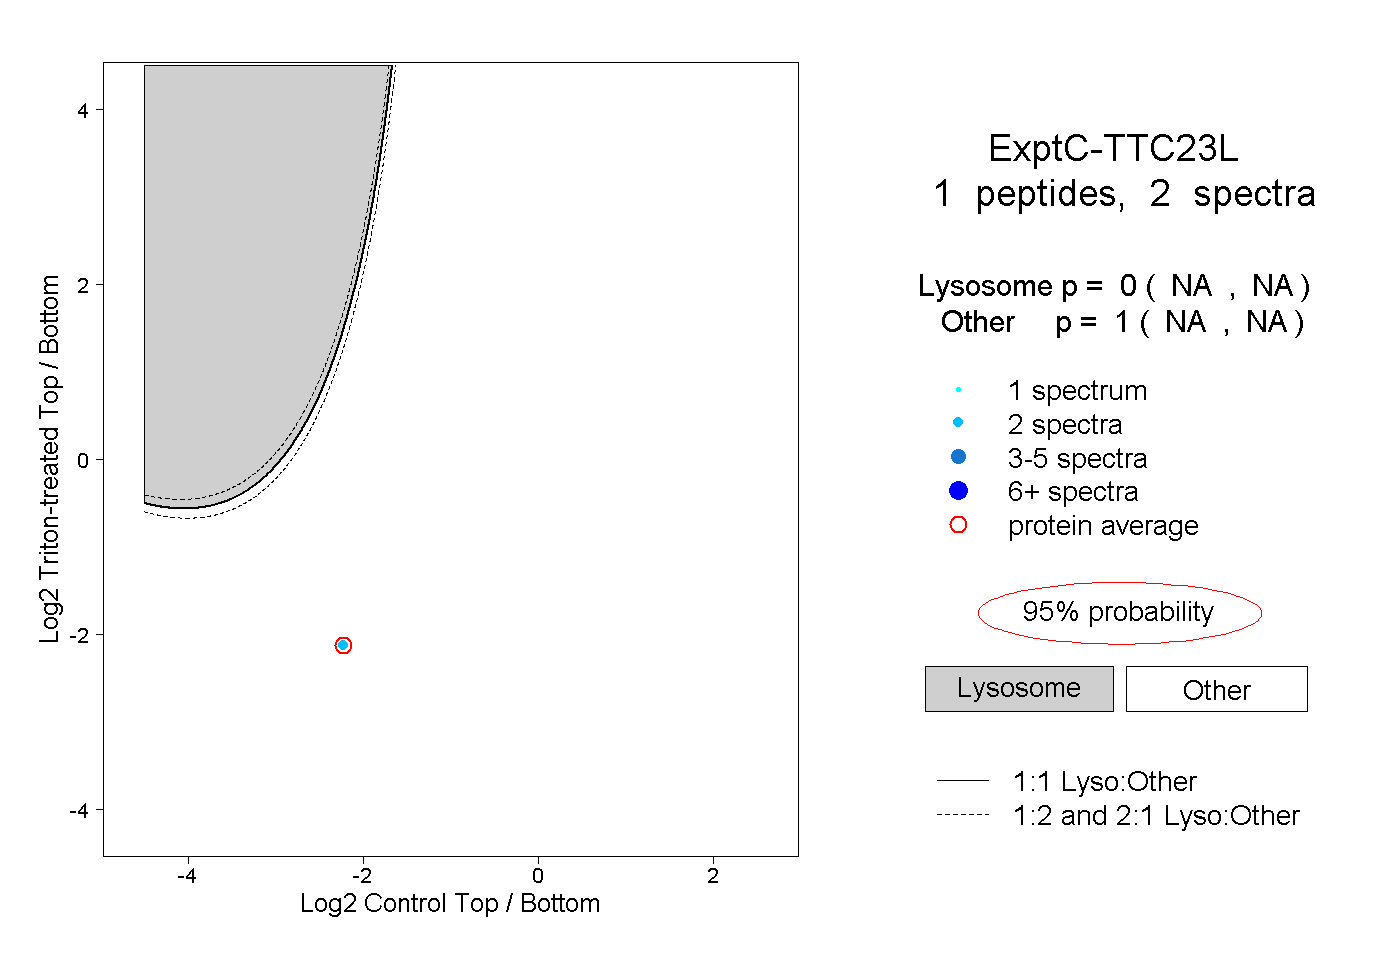
| Plot | Lyso | Other | |||||||||||
| Expt C |
1 peptide |
2 spectra |
|
0.000 NA | NA |
1.000 NA | NA |