 3
3peptides
spectra
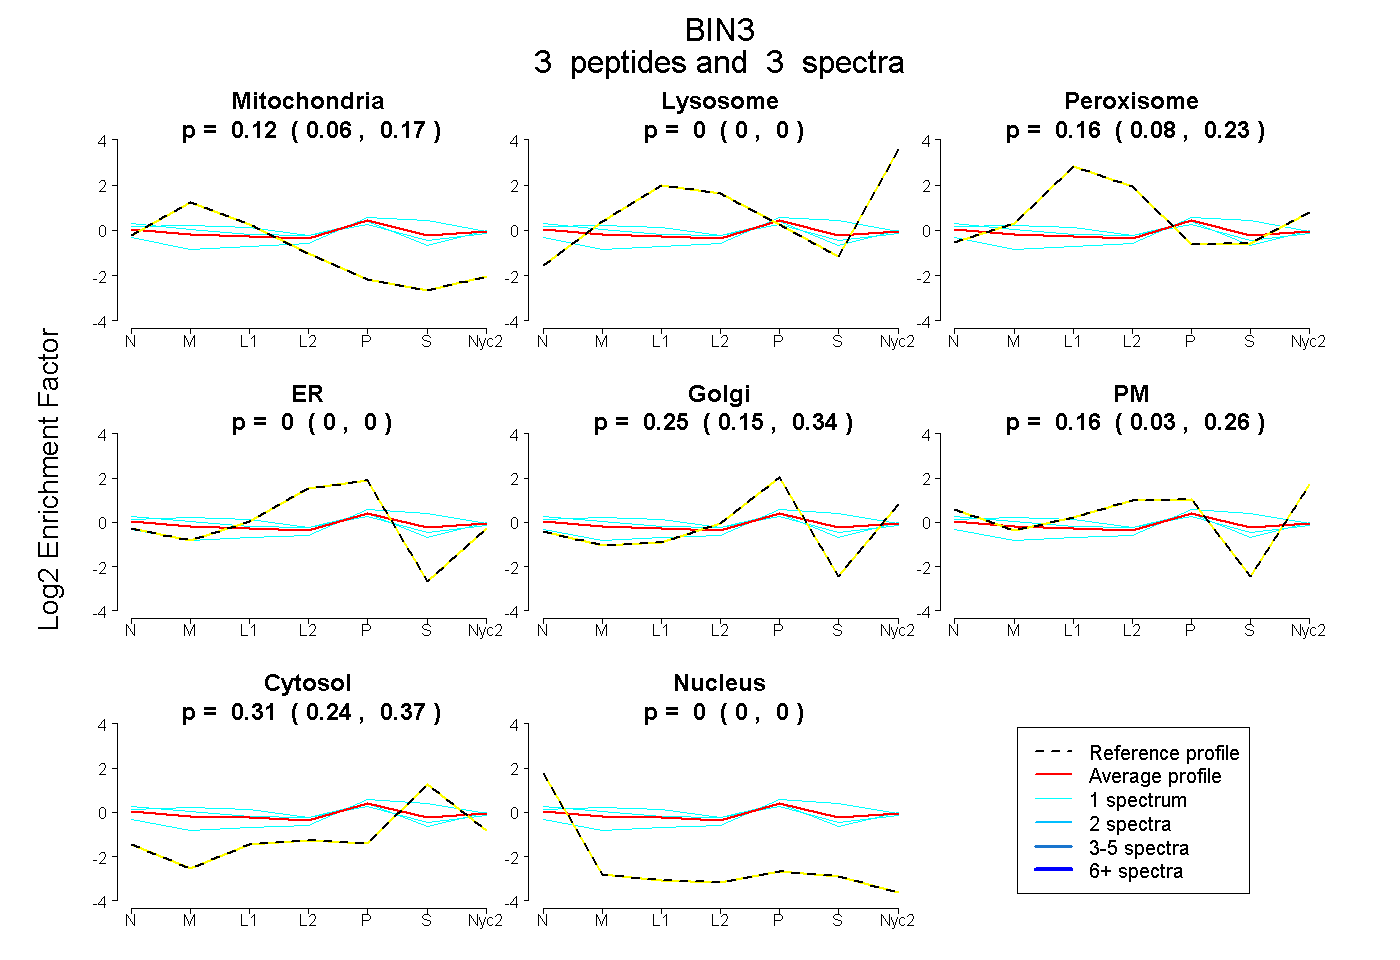
0.065 | 0.170
0.000 | 0.000
0.081 | 0.233
0.000 | 0.000
0.147 | 0.337
0.029 | 0.262
0.239 | 0.371
0.000 | 0.000
| Plot | Mito | Lyso | Perox | ER | Golgi | PM | Cytosol | Nucleus | |||||
| Expt A |
3 peptides |
3 spectra |
|
0.120 0.065 | 0.170 |
0.000 0.000 | 0.000 |
0.162 0.081 | 0.233 |
0.000 0.000 | 0.000 |
0.251 0.147 | 0.337 |
0.156 0.029 | 0.262 |
0.311 0.239 | 0.371 |
0.000 0.000 | 0.000 |
| 1 spectrum, MVTALDTAMK | 0.000 | 0.000 | 0.149 | 0.000 | 0.368 | 0.010 | 0.473 | 0.000 | ||
| 1 spectrum, EQALQDYGR | 0.186 | 0.000 | 0.115 | 0.000 | 0.126 | 0.298 | 0.274 | 0.000 | ||
| 1 spectrum, FGSIFPSLNMAVK | 0.191 | 0.000 | 0.215 | 0.000 | 0.256 | 0.157 | 0.181 | 0.000 |
| Plot | Lyso | Other | |||||||||||
| Expt C |
2 peptides |
2 spectra |
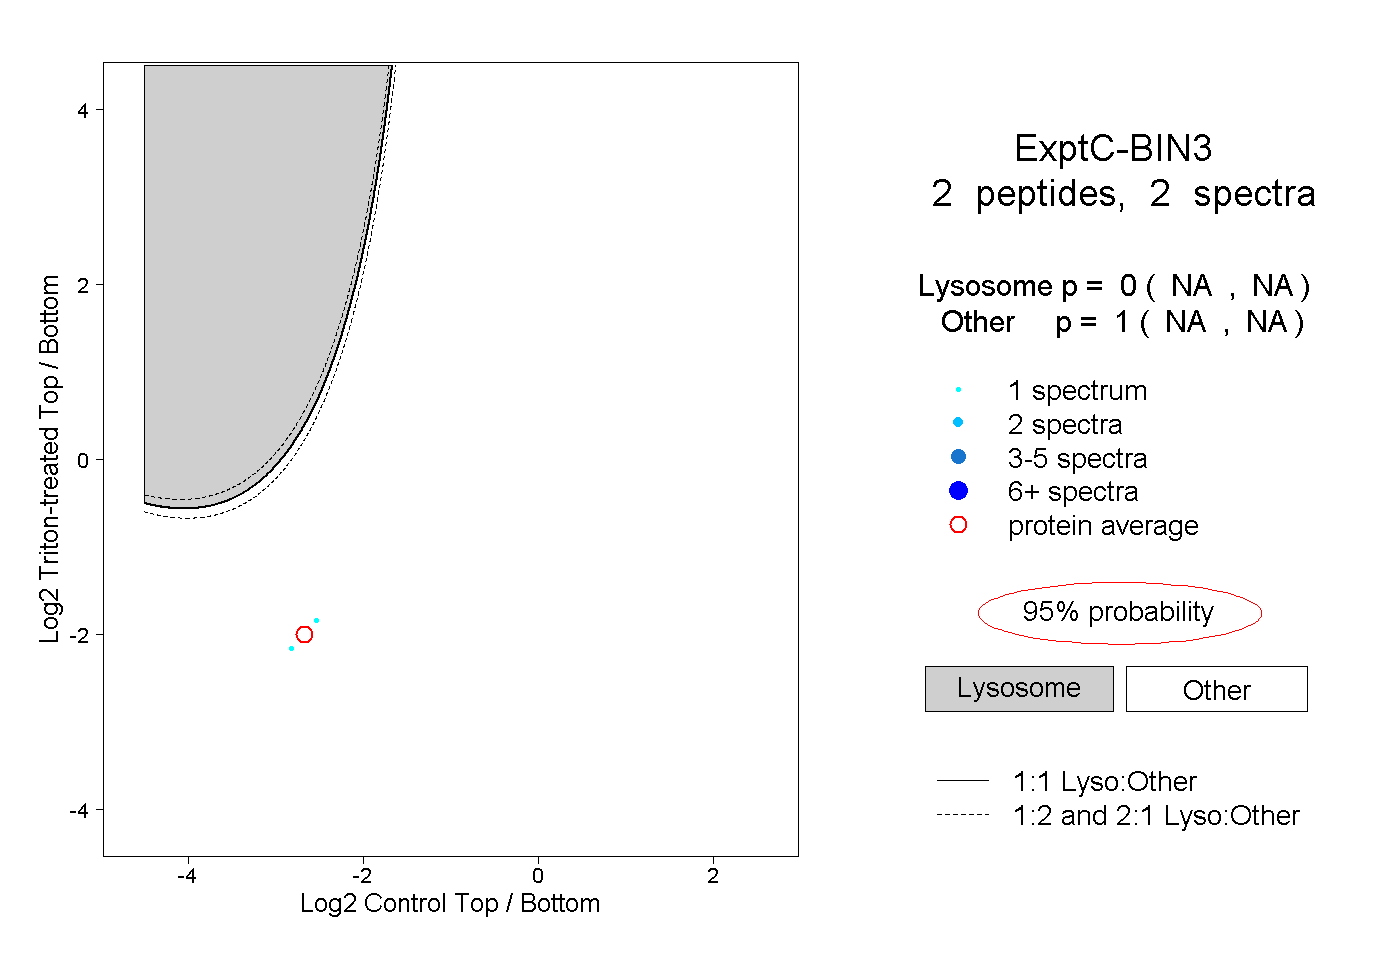 |
0.000 NA | NA |
1.000 NA | NA |