10
10peptides
spectra
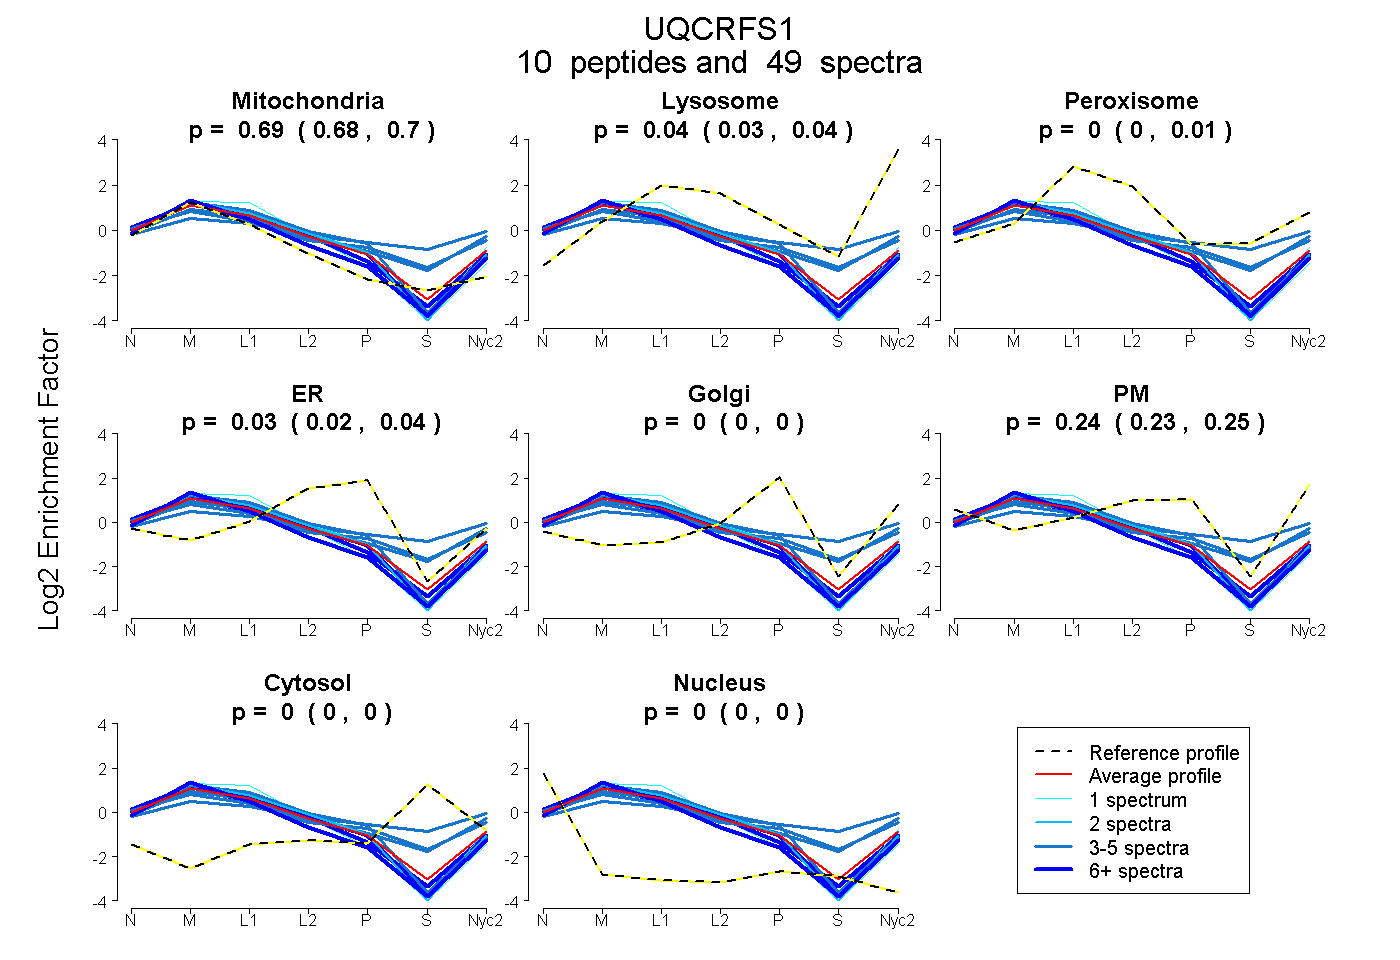
0.684 | 0.696
0.026 | 0.042
0.000 | 0.014
0.018 | 0.042
0.000 | 0.000
0.227 | 0.254
0.000 | 0.000
0.000 | 0.000
7peptides
spectra
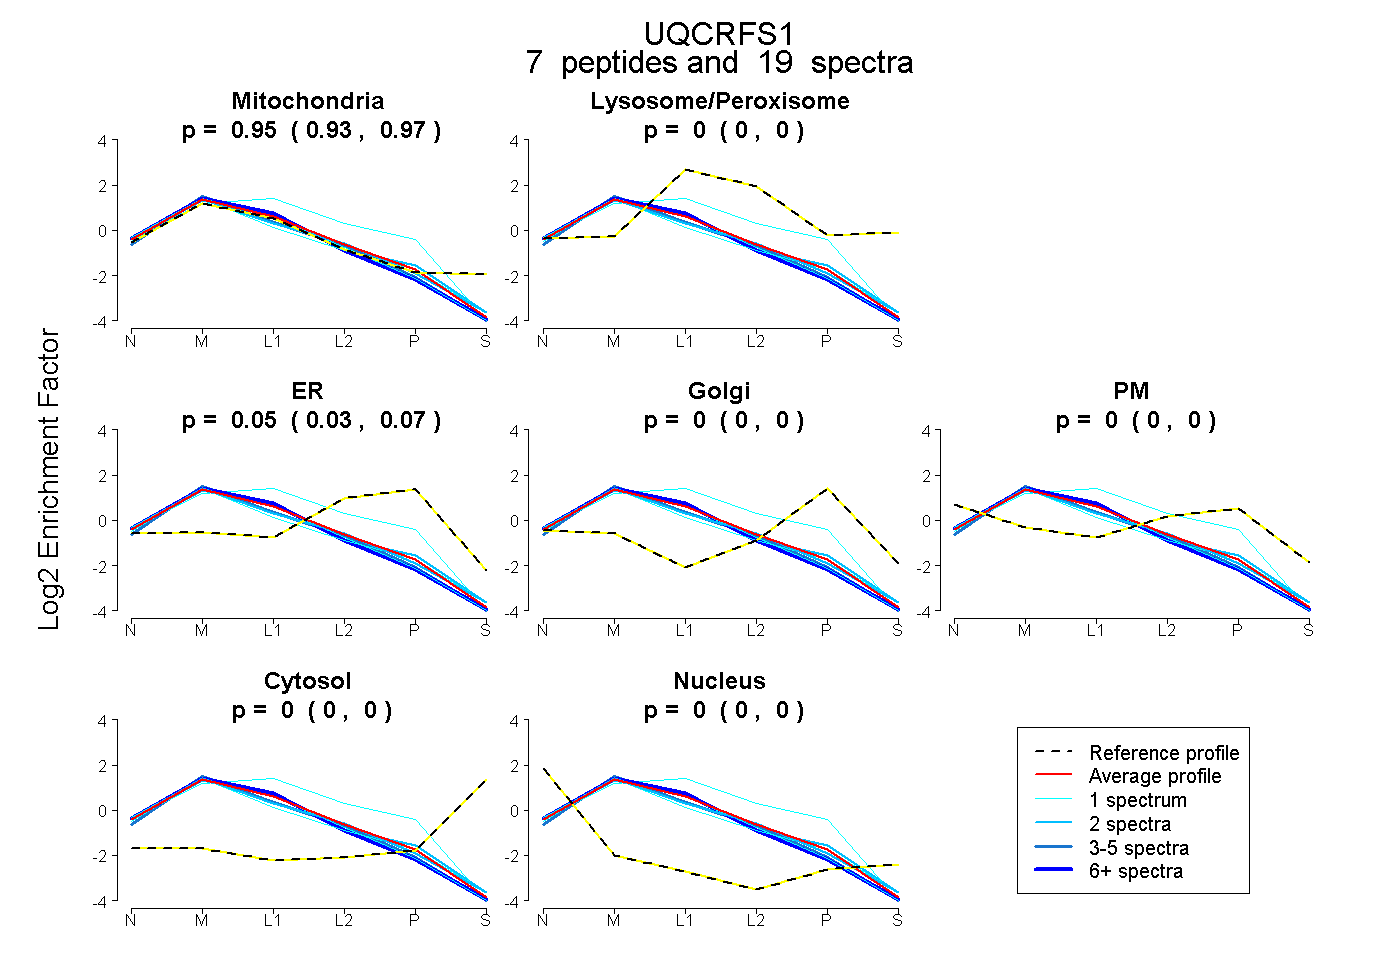
0.932 | 0.967
0.000 | 0.000
0.029 | 0.065
0.000 | 0.000
0.000 | 0.000
0.000 | 0.000
0.000 | 0.000