 10
10peptides
spectra
0.684 | 0.696
0.026 | 0.042
0.000 | 0.014
0.018 | 0.042
0.000 | 0.000
0.227 | 0.254
0.000 | 0.000
0.000 | 0.000
| Plot | Mito | Lyso | Perox | ER | Golgi | PM | Cytosol | Nucleus | |||||
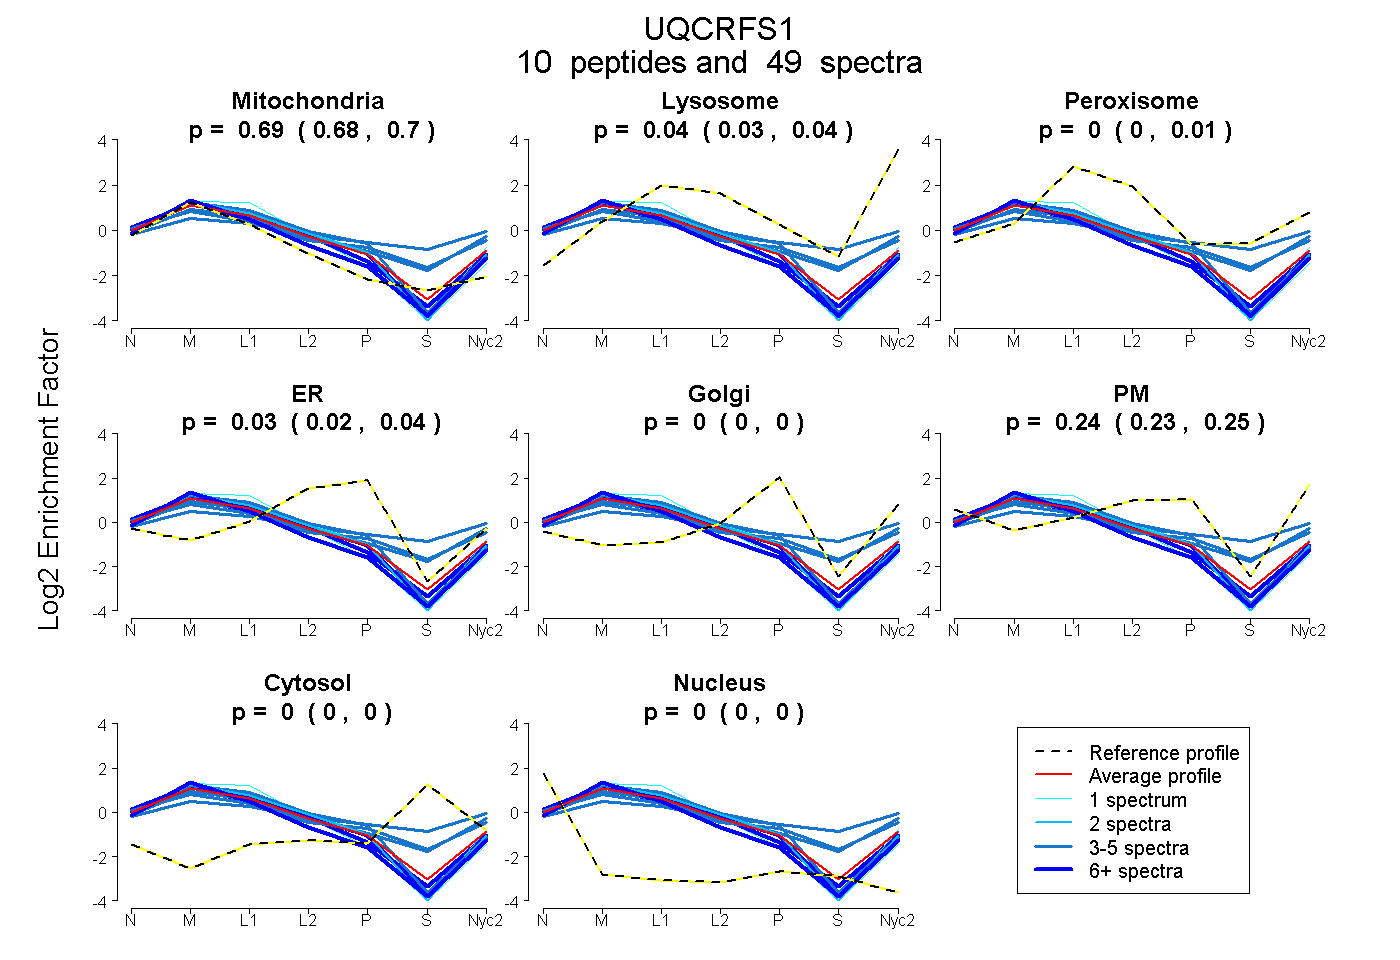
| Expt A |
10 peptides |
49 spectra |
|
0.691 0.684 | 0.696 |
0.037 0.026 | 0.042 |
0.000 0.000 | 0.014 |
0.032 0.018 | 0.042 |
0.000 0.000 | 0.000 |
0.240 0.227 | 0.254 |
0.000 0.000 | 0.000 |
0.000 0.000 | 0.000 |
| 1 spectrum, ESLSGQAATRPLVATVGLNVPASVR | 0.664 | 0.002 | 0.000 | 0.040 | 0.000 | 0.294 | 0.000 | 0.000 | ||
| 6 spectra, VPDFSDYR | 0.836 | 0.000 | 0.000 | 0.000 | 0.000 | 0.164 | 0.000 | 0.000 | ||
| 10 spectra, DPQHDLER | 0.746 | 0.000 | 0.000 | 0.004 | 0.000 | 0.250 | 0.000 | 0.000 | ||
| 1 spectrum, AEVLDSTK | 0.812 | 0.000 | 0.033 | 0.049 | 0.000 | 0.106 | 0.000 | 0.000 | ||
| 4 spectra, LSDIPEGK | 0.529 | 0.029 | 0.091 | 0.000 | 0.011 | 0.264 | 0.076 | 0.000 | ||
| 2 spectra, SGPFAPVLSATSR | 0.700 | 0.000 | 0.000 | 0.111 | 0.000 | 0.189 | 0.000 | 0.000 | ||
| 3 spectra, RPFLCR | 0.649 | 0.017 | 0.000 | 0.247 | 0.000 | 0.087 | 0.000 | 0.000 | ||
| 15 spectra, GKPLFVR | 0.715 | 0.000 | 0.000 | 0.126 | 0.000 | 0.158 | 0.000 | 0.000 | ||
| 4 spectra, NAVSQFVSSMSASADVLAMSK | 0.565 | 0.128 | 0.080 | 0.000 | 0.000 | 0.187 | 0.041 | 0.000 | ||
| 3 spectra, EIDQEAAVEVSQLR | 0.348 | 0.087 | 0.142 | 0.000 | 0.005 | 0.213 | 0.205 | 0.000 |
| Plot | Mito | Lyso or Perox | ER | Golgi | PM | Cytosol | Nucleus | ||||||
| Expt B |
7 peptides |
19 spectra |
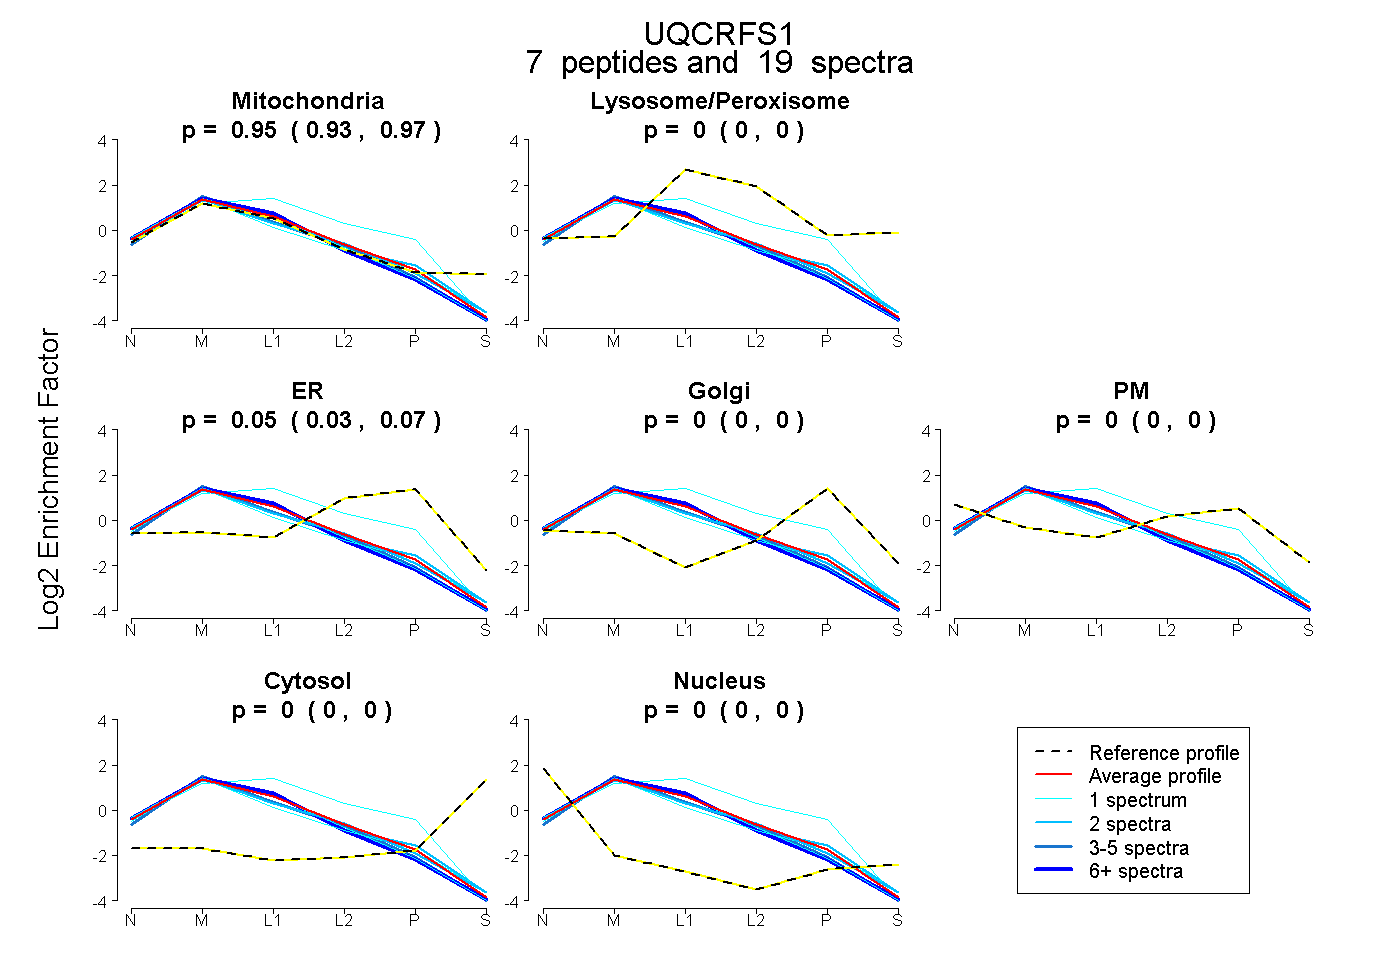 |
0.951 0.932 | 0.967 |
0.000 0.000 | 0.000 |
0.049 0.029 | 0.065 |
0.000 0.000 | 0.000 |
0.000 0.000 | 0.000 |
0.000 0.000 | 0.000 |
0.000 0.000 | 0.000 |
|||
| Plot | Lyso | Other | |||||||||||
| Expt C |
10 peptides |
195 spectra |
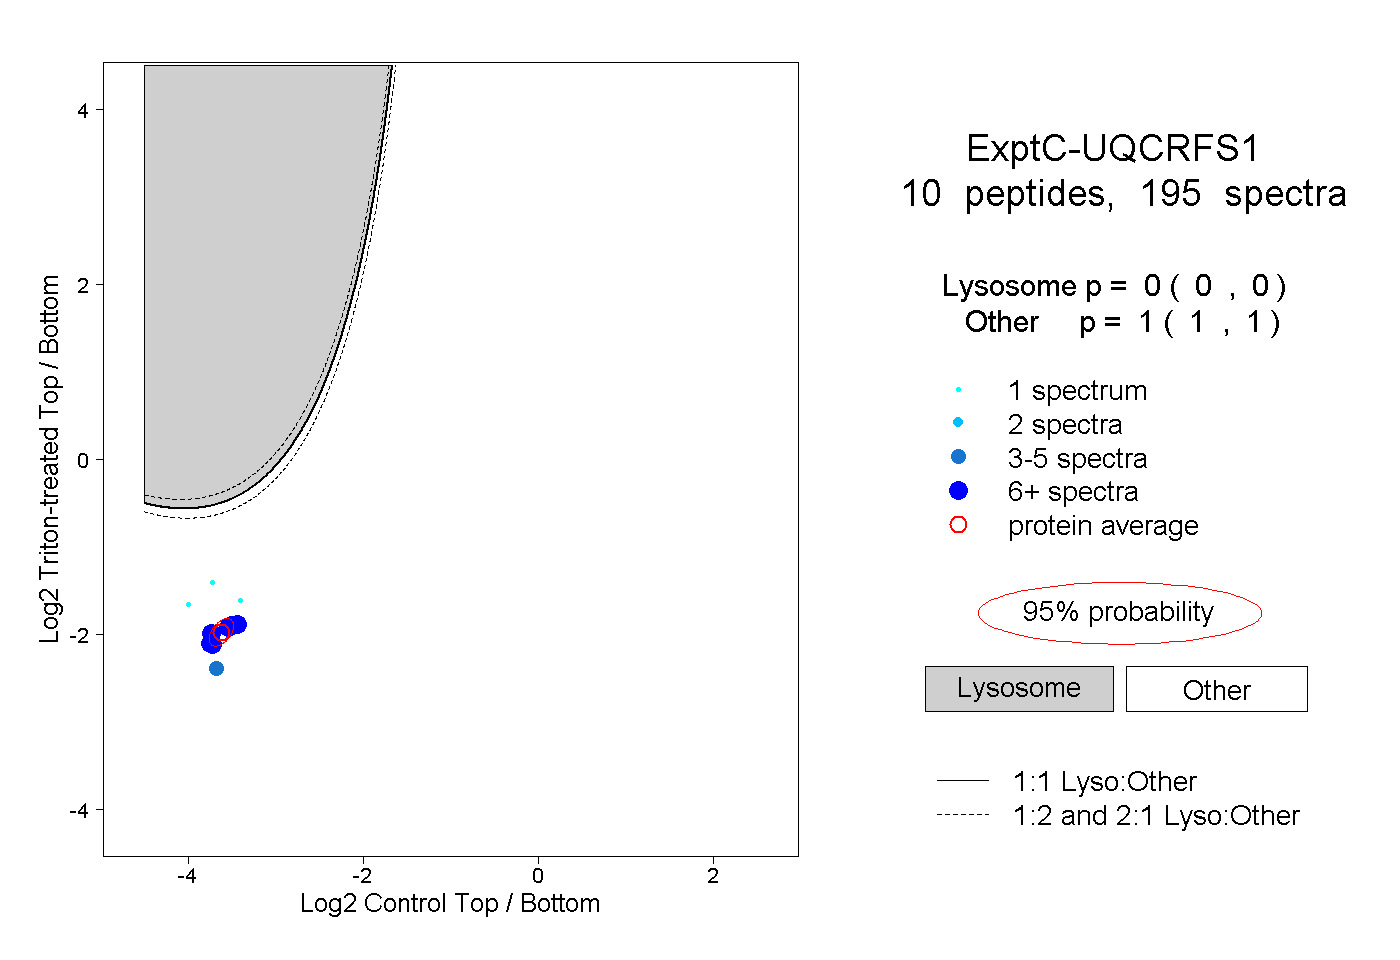 |
0.000 0.000 | 0.000 |
1.000 1.000 | 1.000 |
||||||||
| Plot | Lyso | Other | |||||||||||
| Expt D |
6 peptides |
26 spectra |
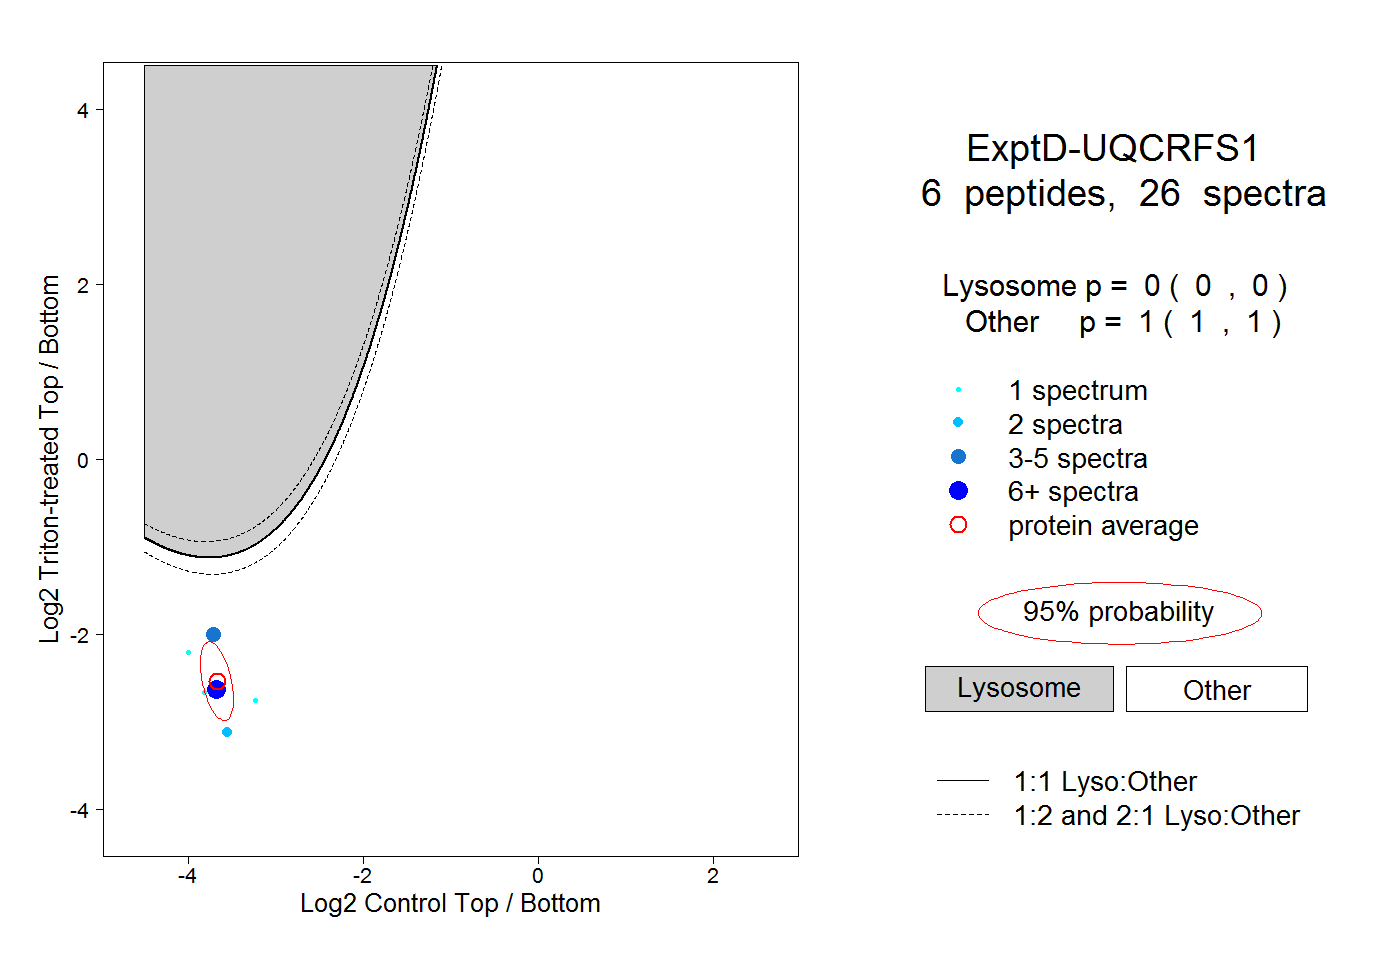 |
0.000 0.000 | 0.000 |
1.000 1.000 | 1.000 |