 21
21peptides
spectra
0.000 | 0.000
0.037 | 0.054
0.000 | 0.000
0.000 | 0.000
0.000 | 0.000
0.025 | 0.042
0.914 | 0.924
0.000 | 0.000
11peptides
spectra
0.000 | 0.000
1.000 | 1.000
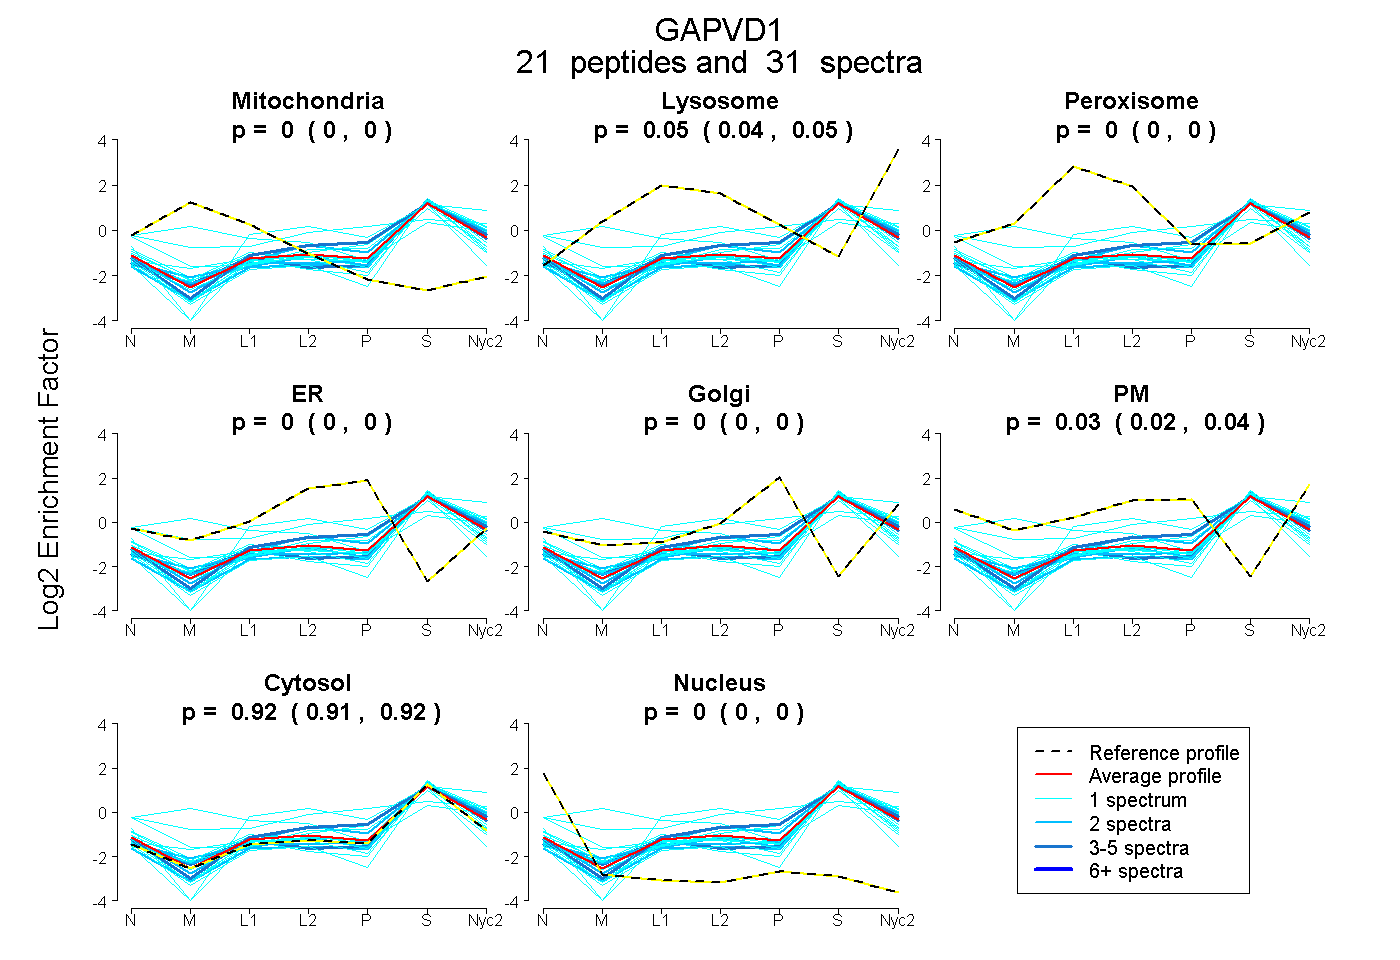
| Plot | Mito | Lyso | Perox | ER | Golgi | PM | Cytosol | Nucleus | |||||
| Expt A |
21 peptides |
31 spectra |
|
0.000 0.000 | 0.000 |
0.046 0.037 | 0.054 |
0.000 0.000 | 0.000 |
0.000 0.000 | 0.000 |
0.000 0.000 | 0.000 |
0.035 0.025 | 0.042 |
0.919 0.914 | 0.924 |
0.000 0.000 | 0.000 |
||
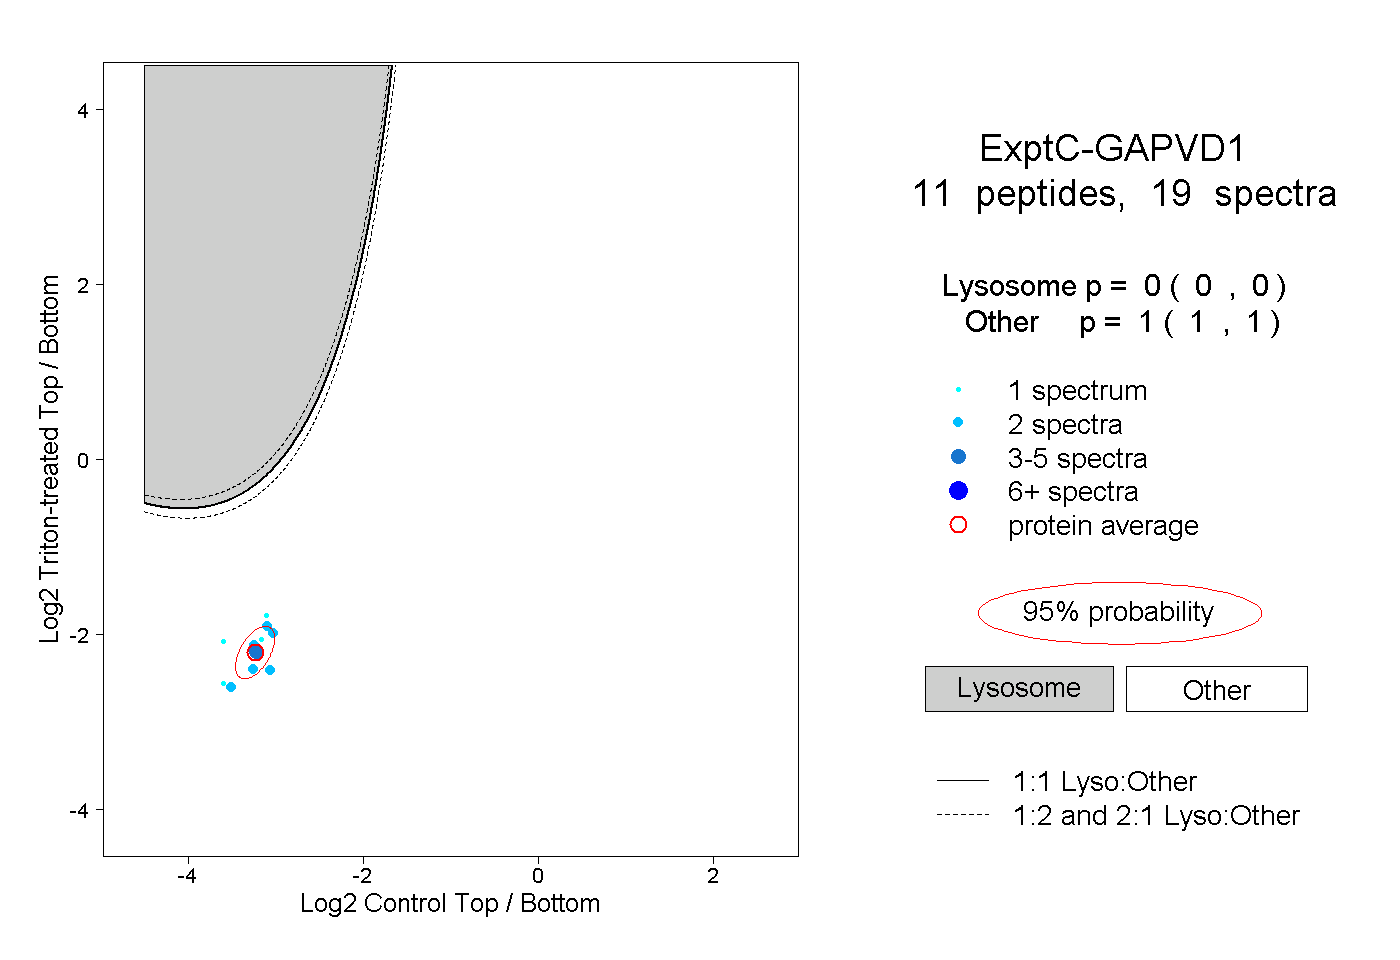
| Plot | Lyso | Other | |||||||||||
| Expt C |
11 peptides |
19 spectra |
|
0.000 0.000 | 0.000 |
1.000 1.000 | 1.000 |
| 2 spectra, LEVGEVR | 0.000 | 1.000 | ||||||||
| 1 spectrum, APIPFR | 0.000 | 1.000 | ||||||||
| 1 spectrum, VQEMVDSNEAK | 0.000 | 1.000 | ||||||||
| 2 spectra, LVALVNK | 0.000 | 1.000 | ||||||||
| 2 spectra, FSPAQQEK | 0.000 | 1.000 | ||||||||
| 3 spectra, VVTANHR | 0.000 | 1.000 | ||||||||
| 1 spectrum, LPIATR | 0.000 | 1.000 | ||||||||
| 2 spectra, SSDIVSCVR | 0.000 | 1.000 | ||||||||
| 1 spectrum, LLASIAEDYR | 0.000 | 1.000 | ||||||||
| 2 spectra, LYVSSEK | 0.000 | 1.000 | ||||||||
| 2 spectra, HSYPER | 0.000 | 1.000 |