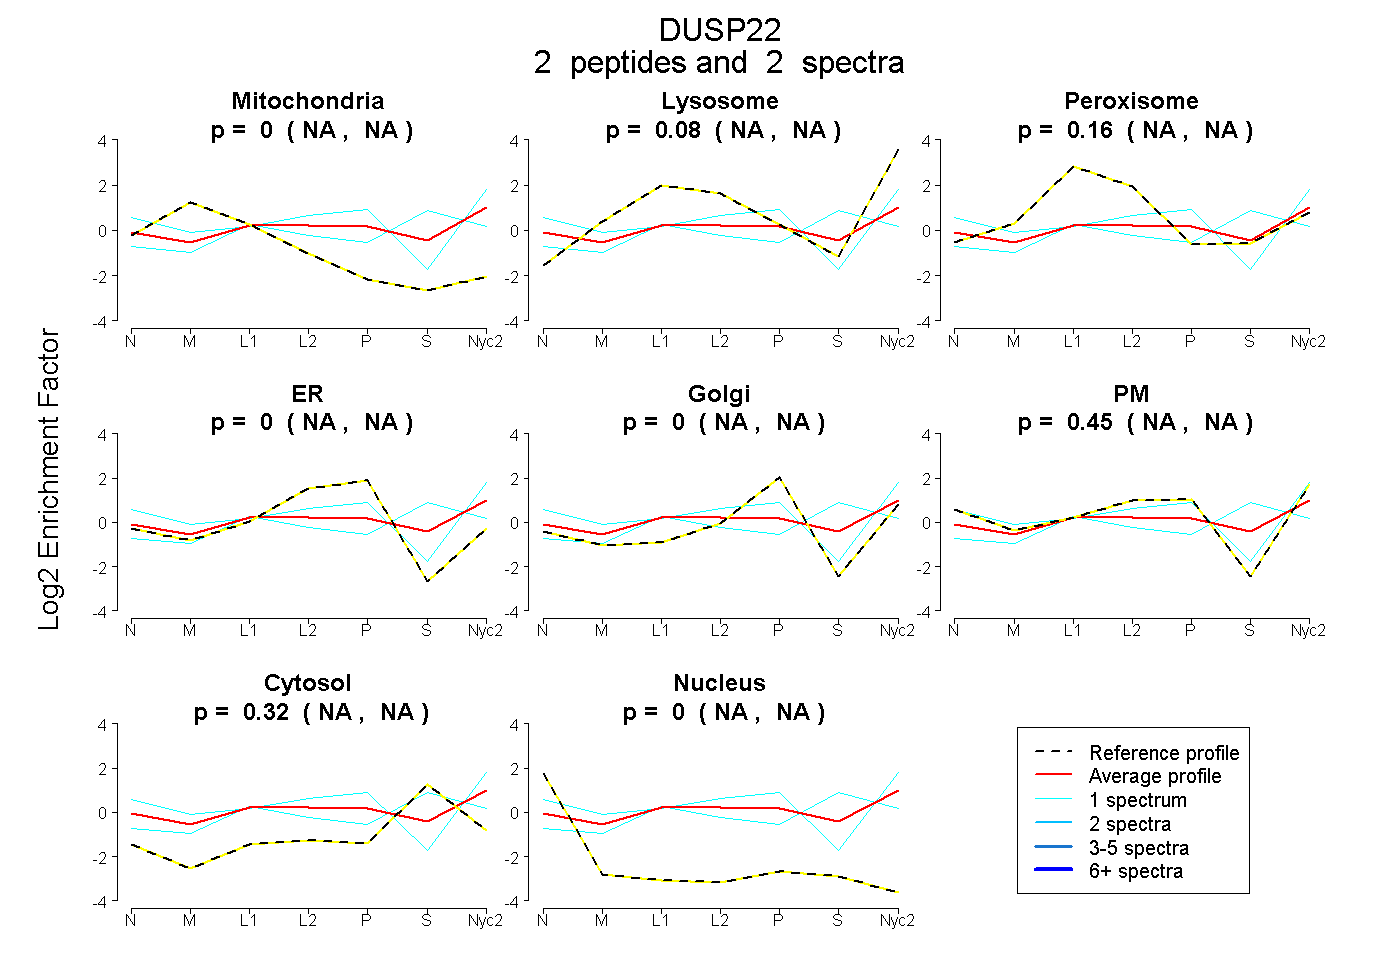
 2
2peptides
spectra
NA | NA
NA | NA
NA | NA
NA | NA
NA | NA
NA | NA
NA | NA
NA | NA
| Plot | Mito | Lyso | Perox | ER | Golgi | PM | Cytosol | Nucleus | |||||
| Expt A |
2 peptides |
2 spectra |
|
0.000 NA | NA |
0.077 NA | NA |
0.156 NA | NA |
0.000 NA | NA |
0.000 NA | NA |
0.447 NA | NA |
0.320 NA | NA |
0.000 NA | NA |
| 1 spectrum, YWAFLR | 0.000 | 0.078 | 0.000 | 0.000 | 0.000 | 0.852 | 0.071 | 0.000 | ||
| 1 spectrum, SCANPNLGFQR | 0.000 | 0.069 | 0.323 | 0.000 | 0.000 | 0.041 | 0.567 | 0.000 |
| Plot | Lyso | Other | |||||||||||
| Expt C |
1 peptide |
1 spectrum |
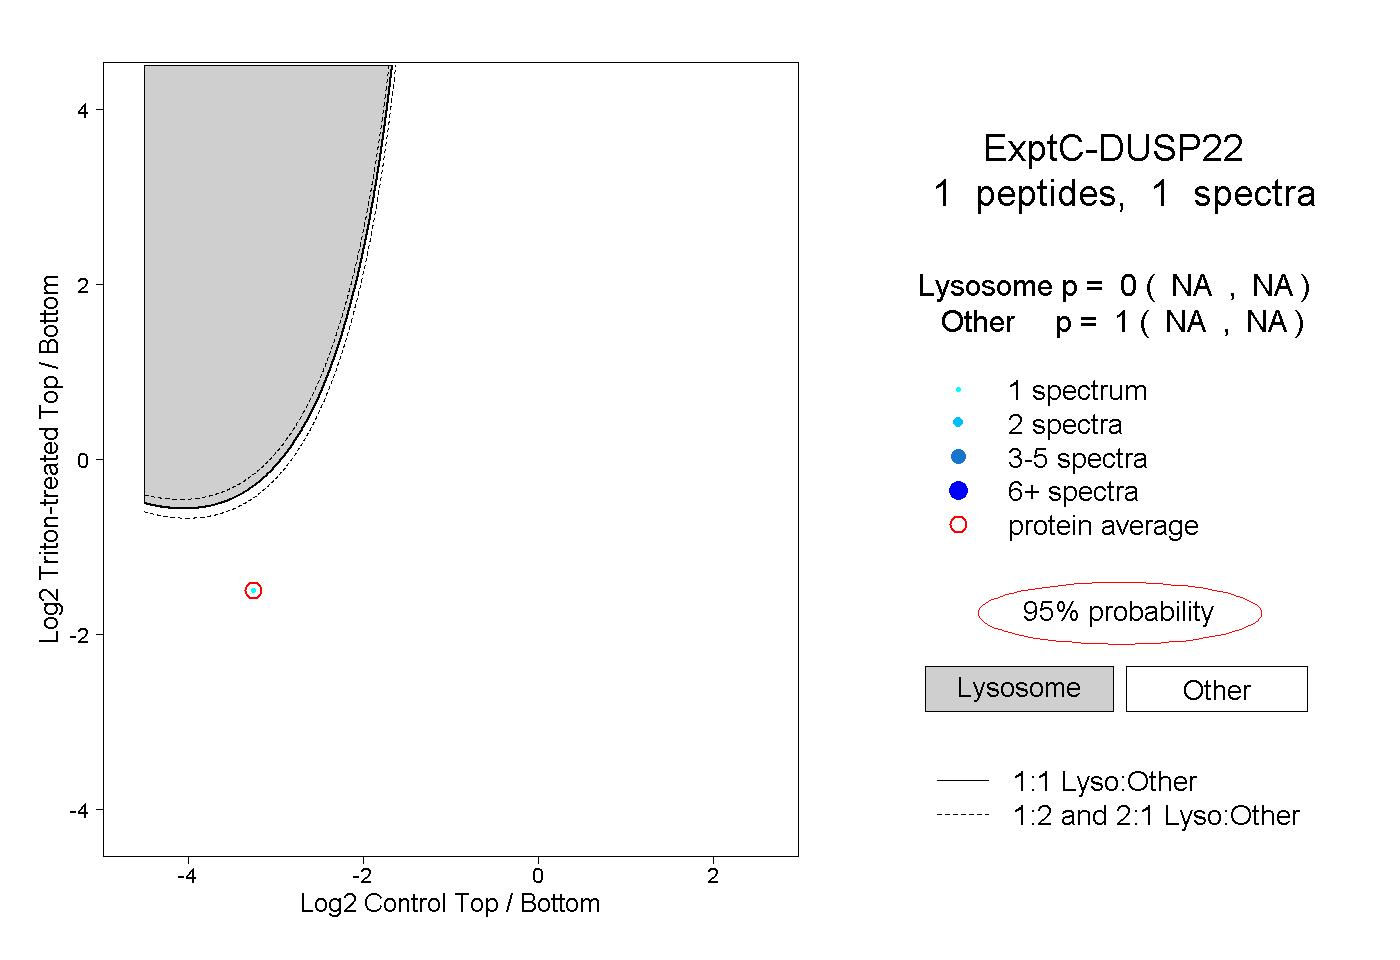 |
0.000 NA | NA |
1.000 NA | NA |