 24
24peptides
spectra
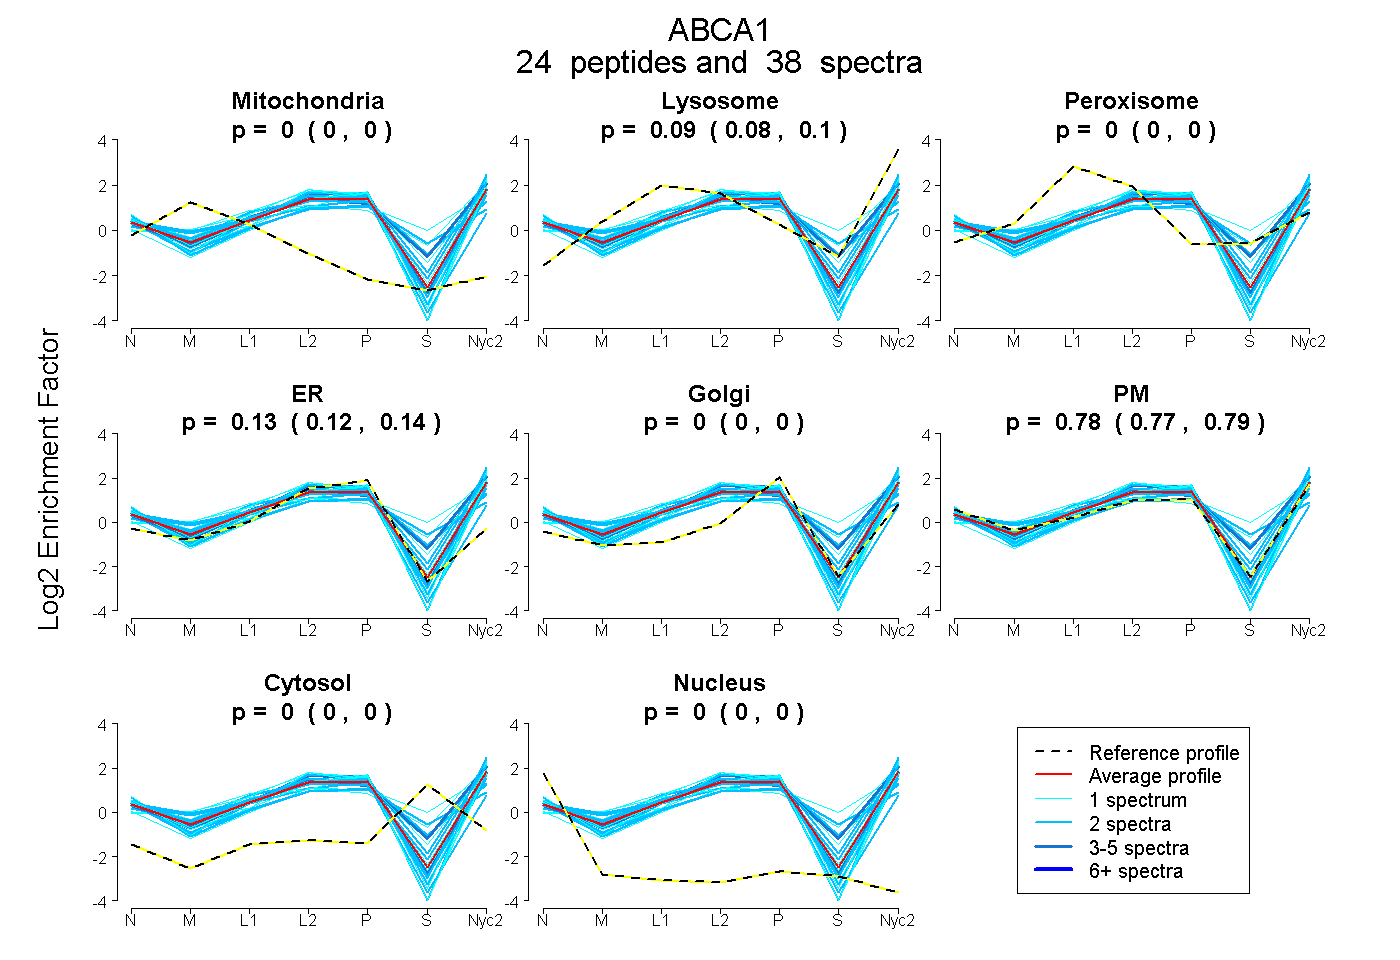
0.000 | 0.000
0.079 | 0.095
0.000 | 0.000
0.120 | 0.138
0.000 | 0.000
0.769 | 0.793
0.000 | 0.000
0.000 | 0.000
| Plot | Mito | Lyso | Perox | ER | Golgi | PM | Cytosol | Nucleus | |||||
| Expt A |
24 peptides |
38 spectra |
|
0.000 0.000 | 0.000 |
0.088 0.079 | 0.095 |
0.000 0.000 | 0.000 |
0.130 0.120 | 0.138 |
0.000 0.000 | 0.000 |
0.782 0.769 | 0.793 |
0.000 0.000 | 0.000 |
0.000 0.000 | 0.000 |
| 1 spectrum, NLESSPLSR | 0.000 | 0.053 | 0.000 | 0.019 | 0.000 | 0.928 | 0.000 | 0.000 | ||
| 3 spectra, NQAMADALER | 0.000 | 0.224 | 0.027 | 0.005 | 0.000 | 0.683 | 0.062 | 0.000 | ||
| 3 spectra, EHLEFFALLR | 0.000 | 0.065 | 0.000 | 0.196 | 0.000 | 0.740 | 0.000 | 0.000 | ||
| 2 spectra, FVSPLSWDLVGR | 0.000 | 0.000 | 0.000 | 0.000 | 0.000 | 1.000 | 0.000 | 0.000 | ||
| 2 spectra, LGDLEVSALCSLPR | 0.044 | 0.000 | 0.000 | 0.401 | 0.000 | 0.555 | 0.000 | 0.000 | ||
| 1 spectrum, ILLYSQK | 0.000 | 0.005 | 0.000 | 0.145 | 0.000 | 0.850 | 0.000 | 0.000 | ||
| 1 spectrum, EGAFVELFHEIDDR | 0.000 | 0.000 | 0.000 | 0.079 | 0.000 | 0.921 | 0.000 | 0.000 | ||
| 2 spectra, GNDQFWER | 0.000 | 0.000 | 0.041 | 0.018 | 0.000 | 0.766 | 0.174 | 0.000 | ||
| 1 spectrum, ETDLLSGMDGK | 0.000 | 0.232 | 0.000 | 0.021 | 0.000 | 0.464 | 0.283 | 0.000 | ||
| 1 spectrum, VVILDEPTAGVDPYSR | 0.000 | 0.000 | 0.000 | 0.152 | 0.000 | 0.848 | 0.000 | 0.000 | ||
| 1 spectrum, SMELLDER | 0.000 | 0.158 | 0.000 | 0.131 | 0.000 | 0.677 | 0.034 | 0.000 | ||
| 1 spectrum, LGVSIQNLVK | 0.000 | 0.000 | 0.000 | 0.159 | 0.000 | 0.841 | 0.000 | 0.000 | ||
| 2 spectra, IVCGHPEGGGLK | 0.000 | 0.000 | 0.125 | 0.100 | 0.000 | 0.551 | 0.225 | 0.000 | ||
| 2 spectra, SYWFGEEIDEK | 0.000 | 0.061 | 0.000 | 0.183 | 0.000 | 0.756 | 0.000 | 0.000 | ||
| 1 spectrum, LTQQQFVALLWK | 0.000 | 0.039 | 0.000 | 0.068 | 0.000 | 0.893 | 0.000 | 0.000 | ||
| 1 spectrum, FGDGYTIVVR | 0.000 | 0.022 | 0.000 | 0.182 | 0.000 | 0.797 | 0.000 | 0.000 | ||
| 2 spectra, LEPIPTEVR | 0.000 | 0.180 | 0.000 | 0.000 | 0.038 | 0.781 | 0.000 | 0.000 | ||
| 2 spectra, VWVNEFR | 0.000 | 0.178 | 0.000 | 0.009 | 0.000 | 0.812 | 0.000 | 0.000 | ||
| 1 spectrum, GIWELLLK | 0.000 | 0.069 | 0.000 | 0.049 | 0.000 | 0.882 | 0.000 | 0.000 | ||
| 1 spectrum, FLSSLGR | 0.000 | 0.092 | 0.000 | 0.122 | 0.000 | 0.786 | 0.000 | 0.000 | ||
| 2 spectra, DVESSLSSCR | 0.000 | 0.056 | 0.079 | 0.144 | 0.018 | 0.569 | 0.133 | 0.000 | ||
| 2 spectra, TSQLSGGMQR | 0.000 | 0.090 | 0.000 | 0.000 | 0.000 | 0.910 | 0.000 | 0.000 | ||
| 1 spectrum, DPGFGTR | 0.000 | 0.343 | 0.107 | 0.000 | 0.000 | 0.451 | 0.098 | 0.000 | ||
| 2 spectra, GASEICMEEEPTHLK | 0.000 | 0.073 | 0.000 | 0.285 | 0.000 | 0.642 | 0.000 | 0.000 |
| Plot | Mito | Lyso or Perox | ER | Golgi | PM | Cytosol | Nucleus | ||||||
| Expt B |
4 peptides |
6 spectra |
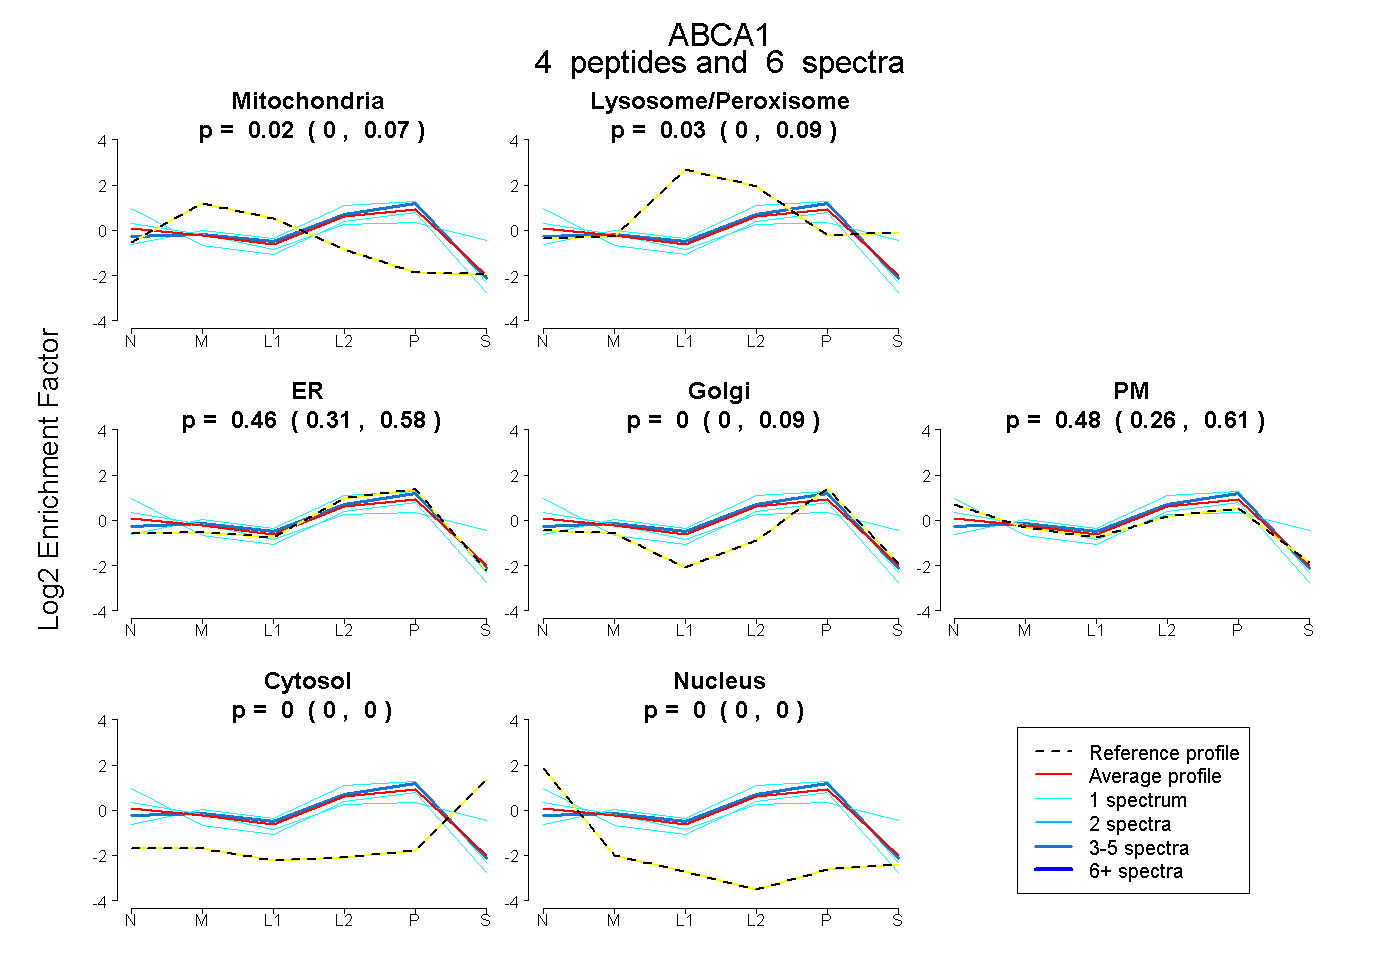 |
0.019 0.000 | 0.073 |
0.033 0.000 | 0.092 |
0.464 0.305 | 0.583 |
0.000 0.000 | 0.088 |
0.484 0.265 | 0.605 |
0.000 0.000 | 0.000 |
0.000 0.000 | 0.000 |
|||
| Plot | Lyso | Other | |||||||||||
| Expt C |
32 peptides |
83 spectra |
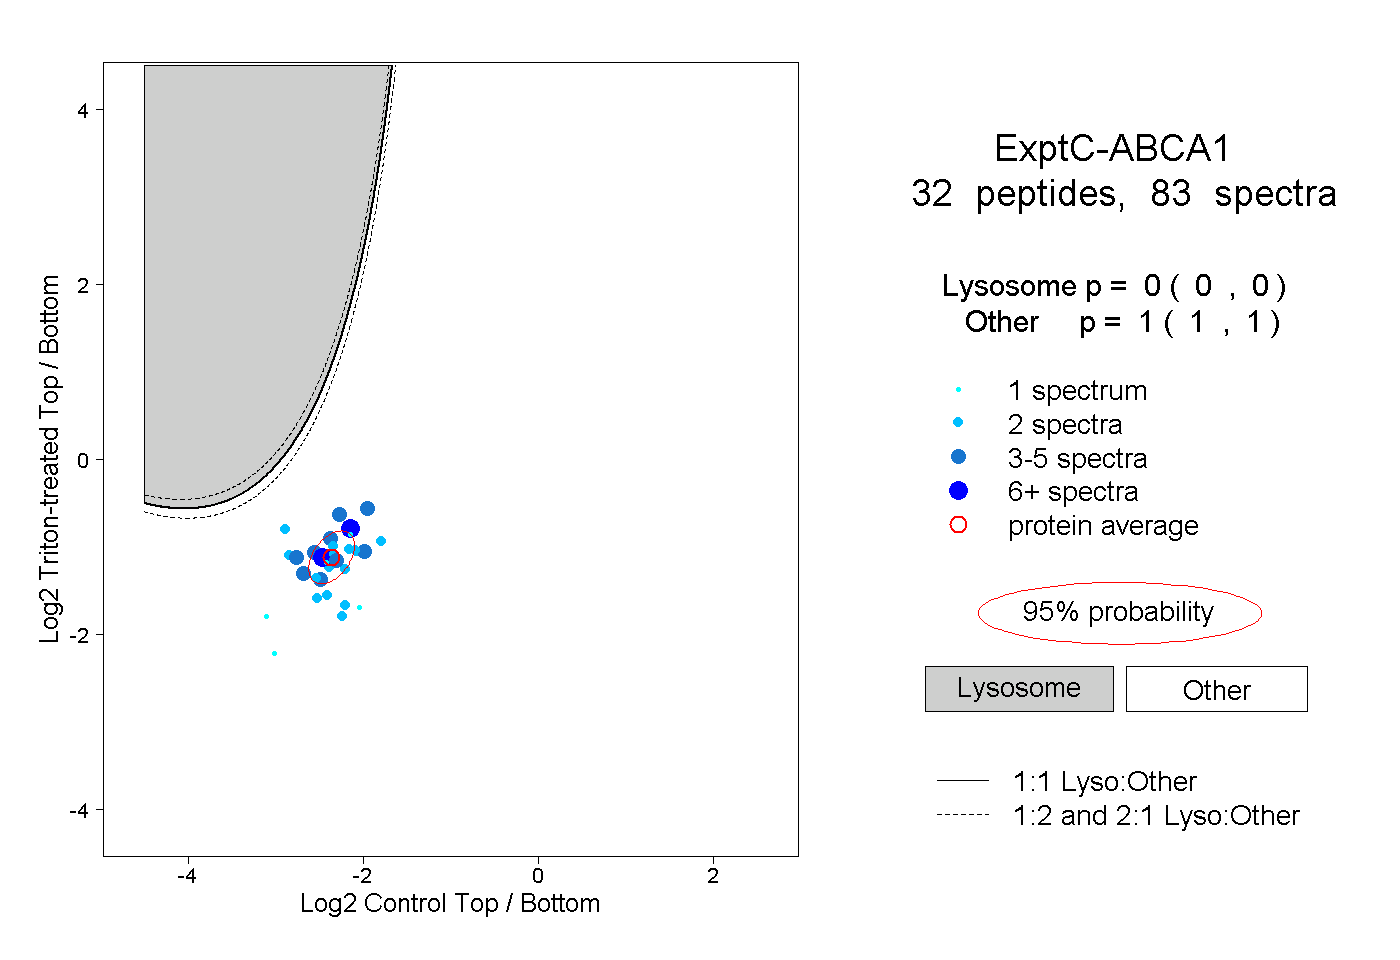 |
0.000 0.000 | 0.000 |
1.000 1.000 | 1.000 |
||||||||
| Plot | Lyso | Other | |||||||||||
| Expt D |
6 peptides |
9 spectra |
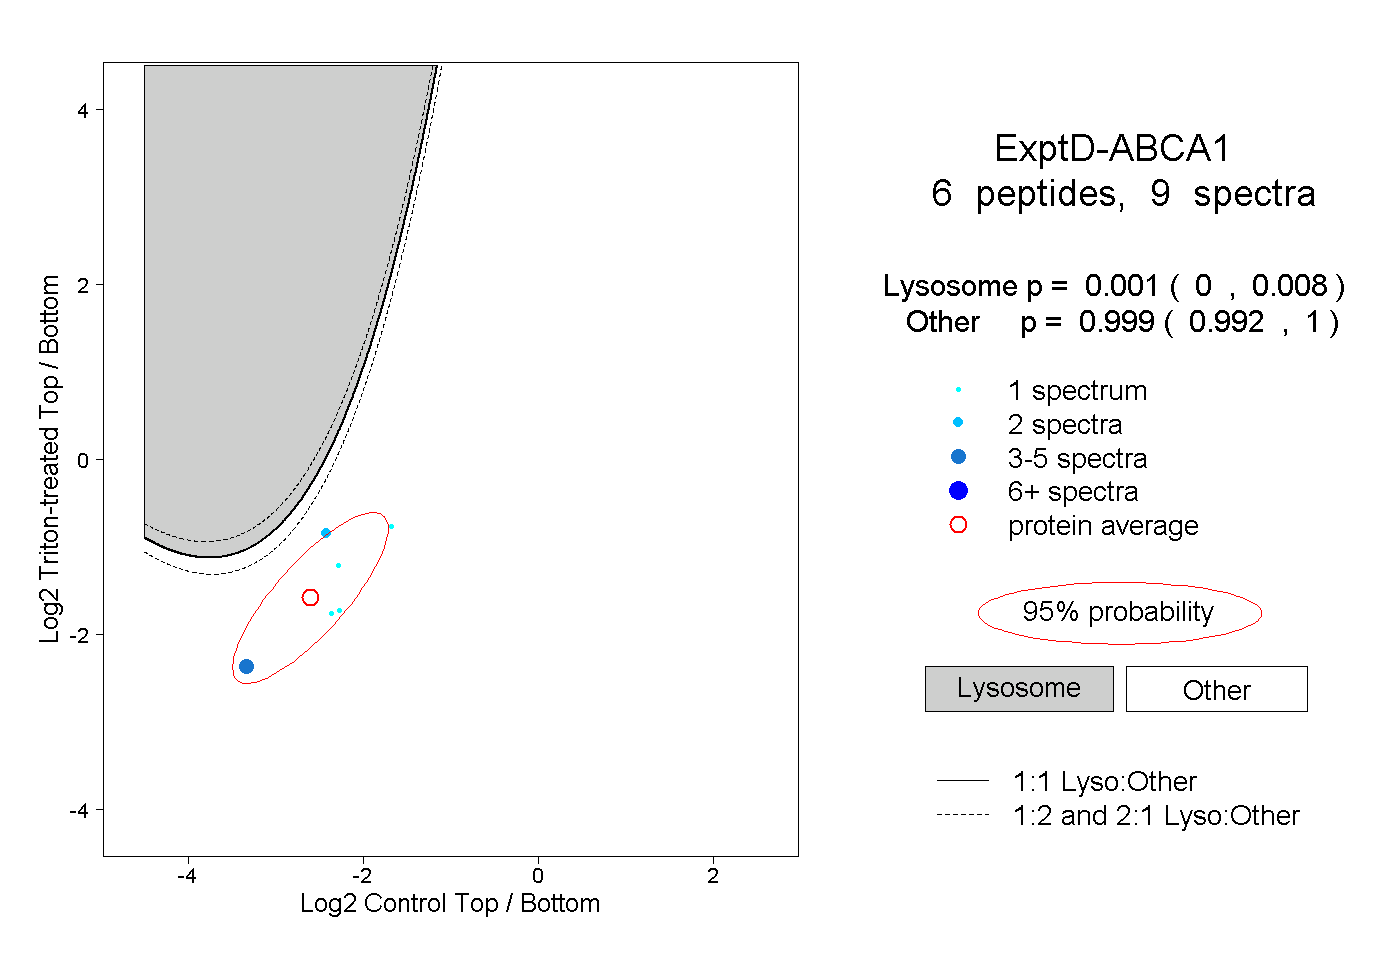 |
0.001 0.000 | 0.008 |
0.999 0.992 | 1.000 |