 24
24peptides
spectra
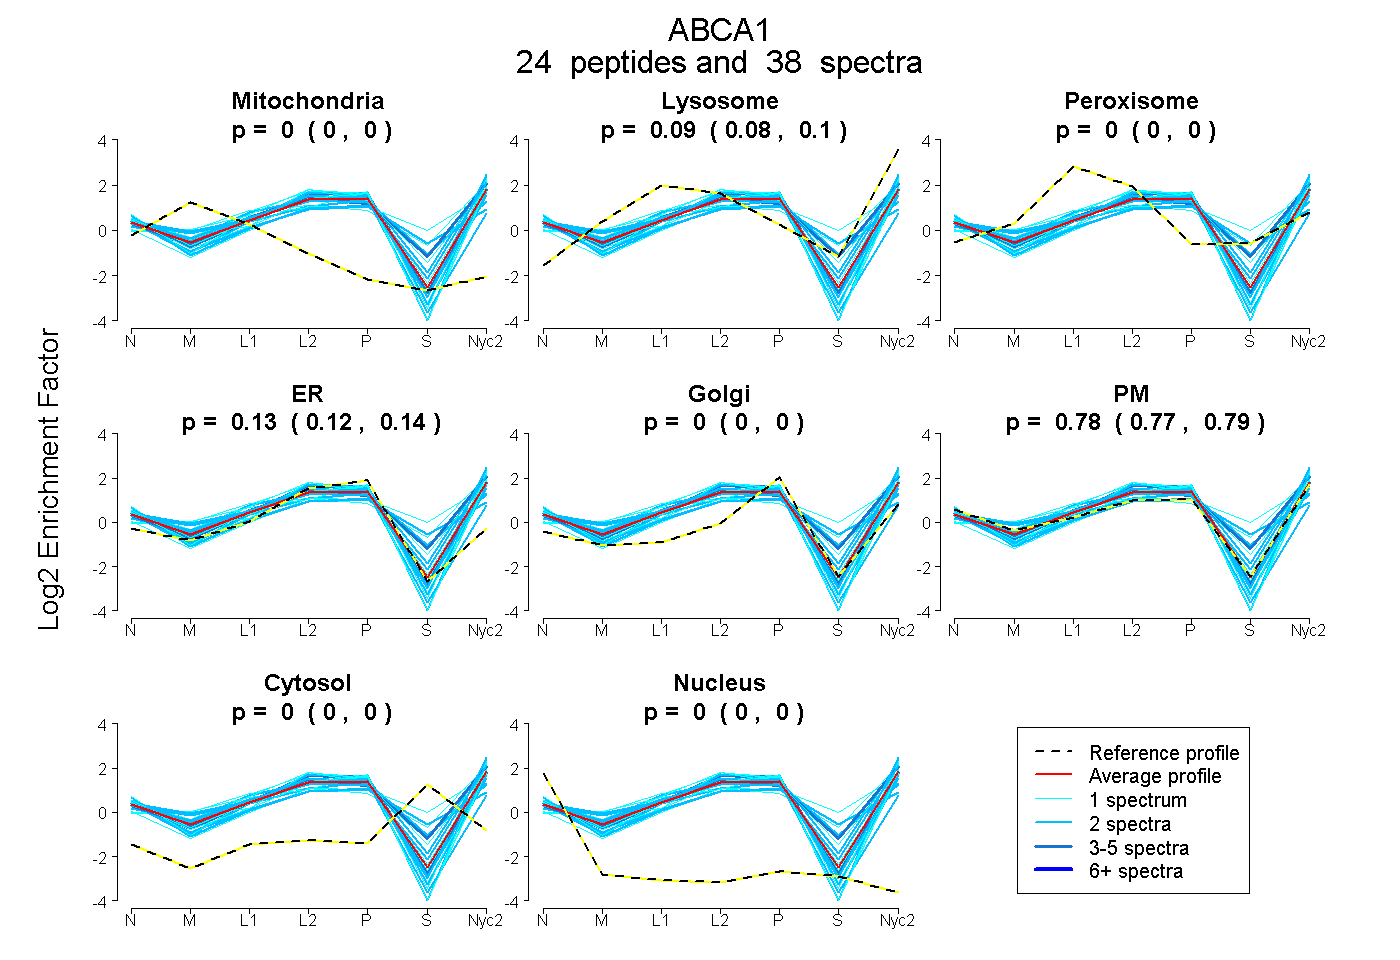
0.000 | 0.000
0.079 | 0.095
0.000 | 0.000
0.120 | 0.138
0.000 | 0.000
0.769 | 0.793
0.000 | 0.000
0.000 | 0.000
4peptides
spectra
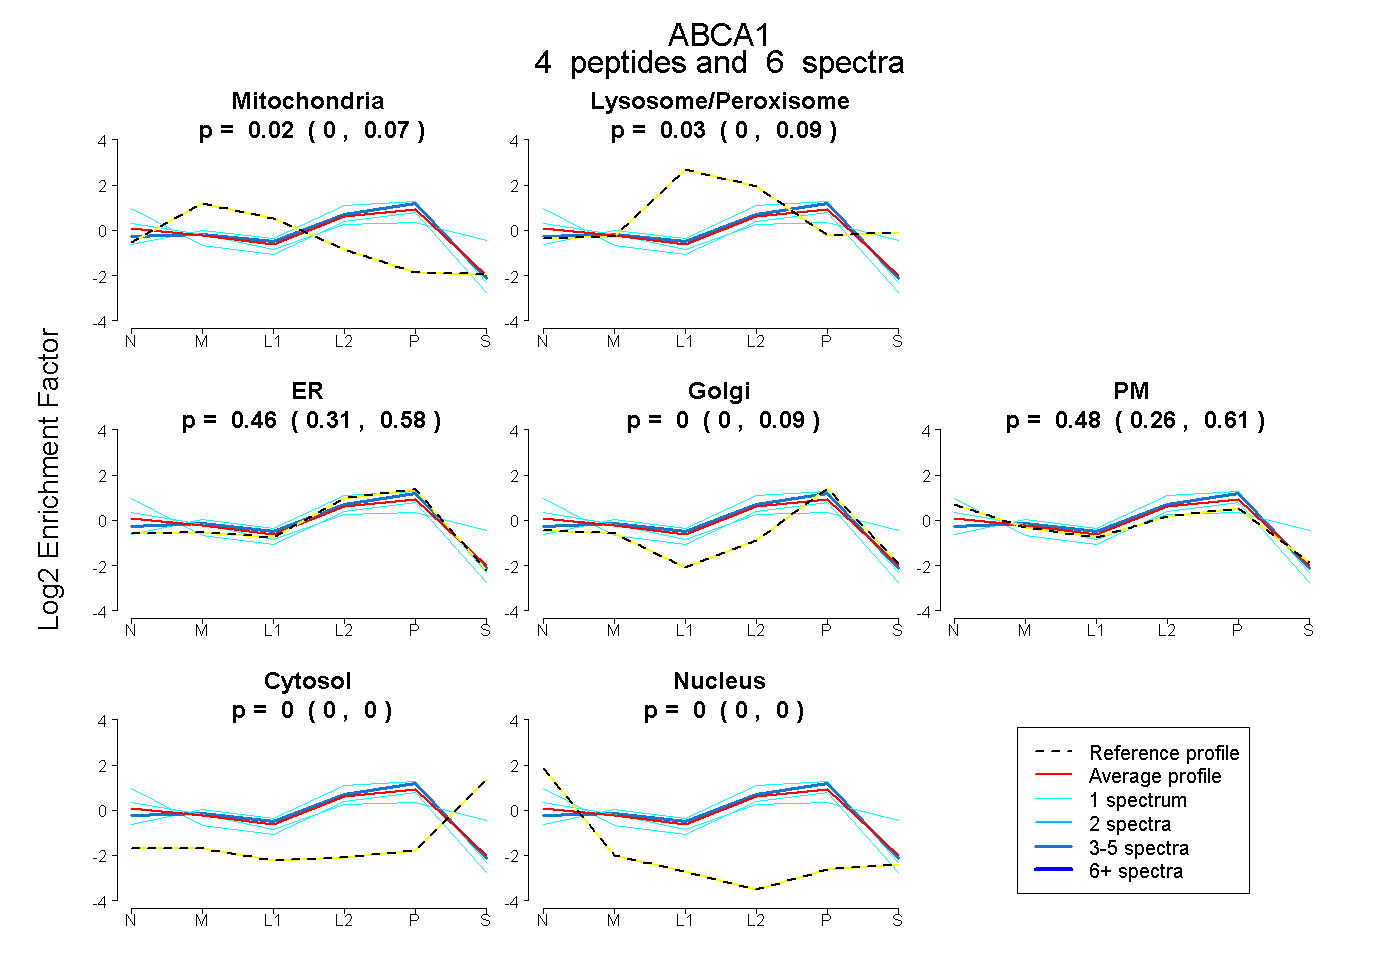
0.000 | 0.073
0.000 | 0.092
0.305 | 0.583
0.000 | 0.088
0.265 | 0.605
0.000 | 0.000
0.000 | 0.000
32peptides
spectra
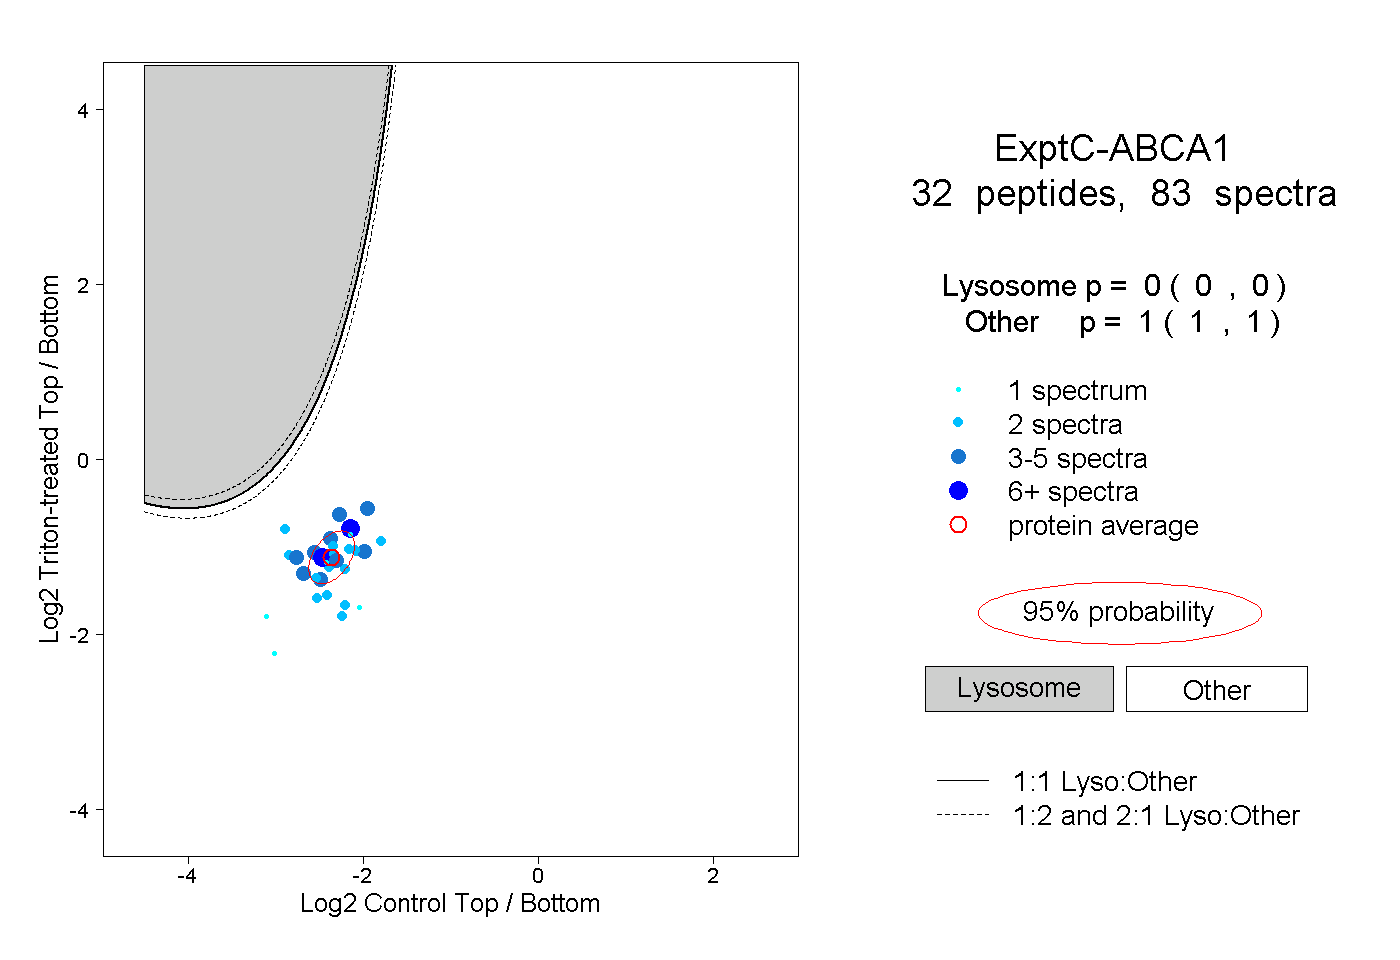
0.000 | 0.000
1.000 | 1.000
6peptides
spectra
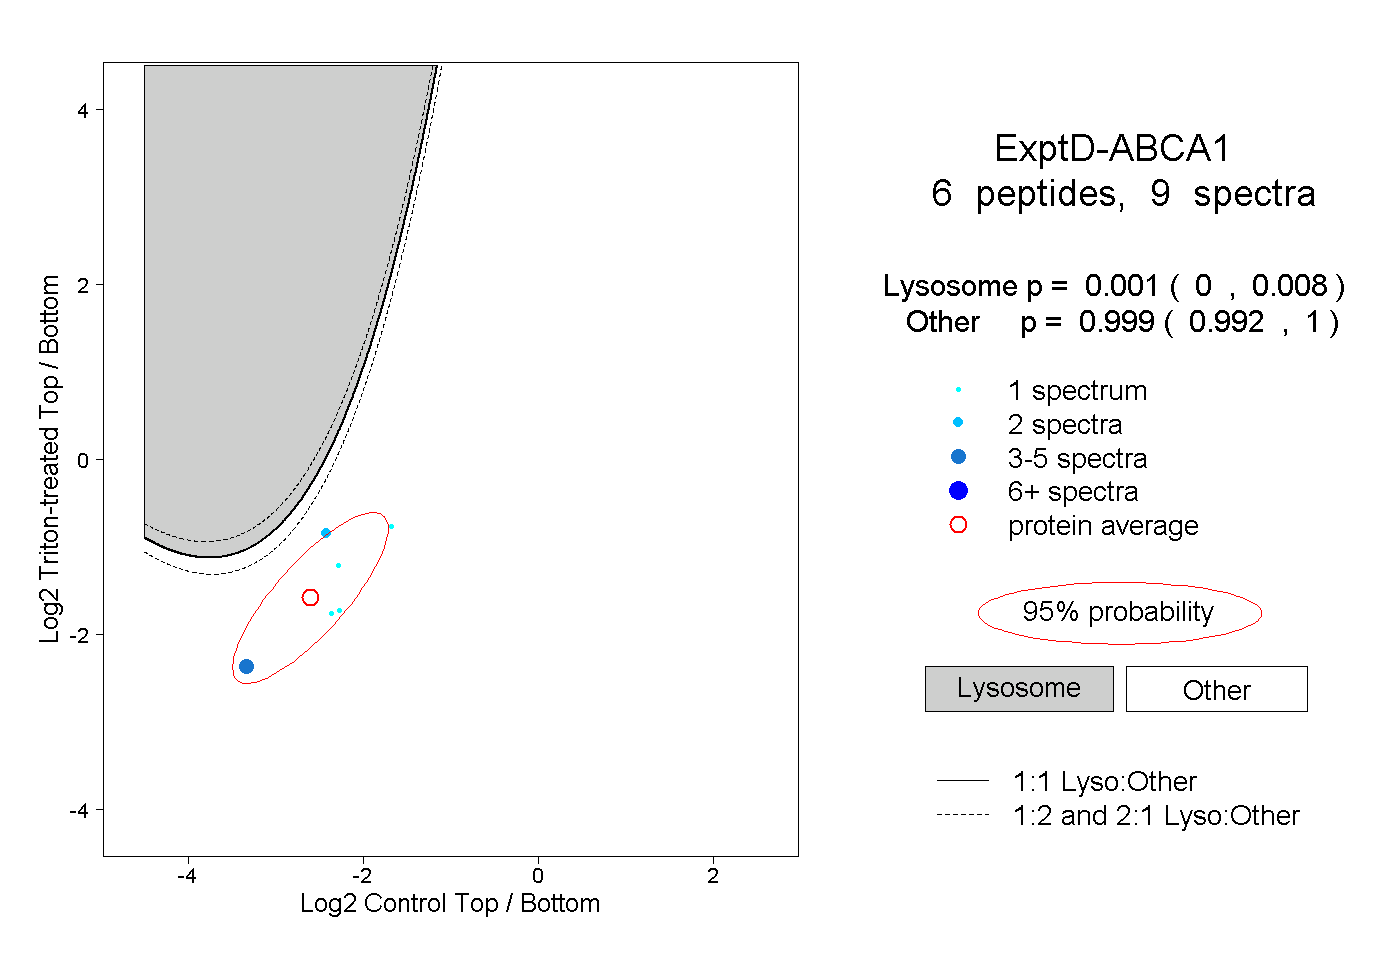
0.000 | 0.008
0.992 | 1.000