 10
10peptides
spectra
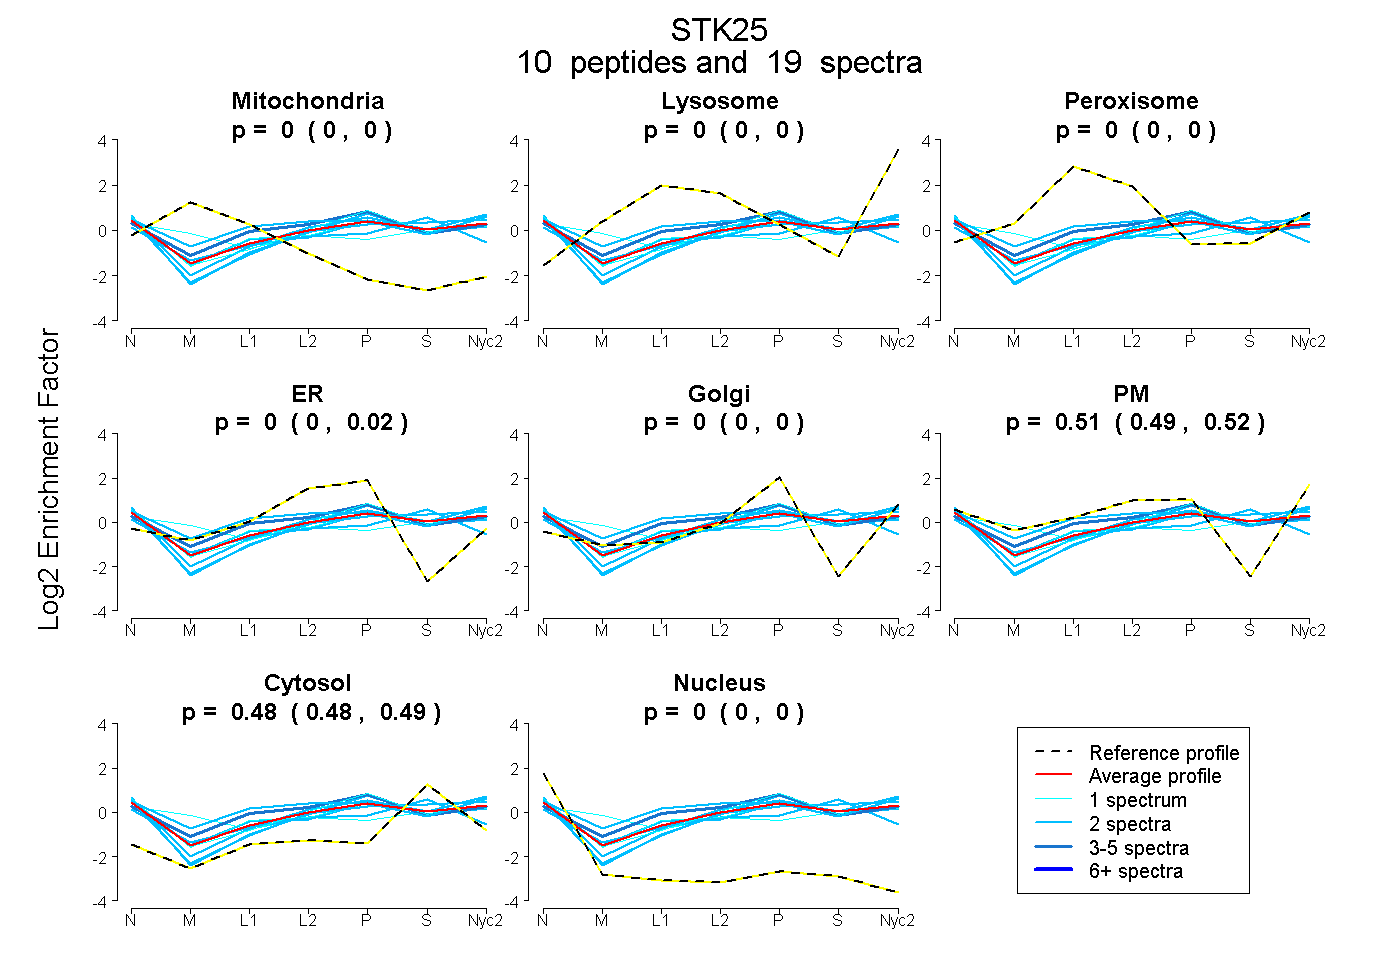
0.000 | 0.000
0.000 | 0.000
0.000 | 0.000
0.000 | 0.019
0.000 | 0.000
0.492 | 0.521
0.477 | 0.490
0.000 | 0.000
| Plot | Mito | Lyso | Perox | ER | Golgi | PM | Cytosol | Nucleus | |||||
| Expt A |
10 peptides |
19 spectra |
|
0.000 0.000 | 0.000 |
0.000 0.000 | 0.000 |
0.000 0.000 | 0.000 |
0.001 0.000 | 0.019 |
0.000 0.000 | 0.000 |
0.515 0.492 | 0.521 |
0.484 0.477 | 0.490 |
0.000 0.000 | 0.000 |
| 2 spectra, YFGSYLK | 0.000 | 0.000 | 0.184 | 0.000 | 0.000 | 0.494 | 0.322 | 0.000 | ||
| 2 spectra, GLDYLHSER | 0.000 | 0.000 | 0.000 | 0.000 | 0.000 | 0.536 | 0.464 | 0.000 | ||
| 1 spectrum, VDPEELFTK | 0.000 | 0.000 | 0.000 | 0.000 | 0.147 | 0.442 | 0.411 | 0.000 | ||
| 2 spectra, GIDNHTK | 0.000 | 0.000 | 0.000 | 0.050 | 0.000 | 0.466 | 0.485 | 0.000 | ||
| 2 spectra, FRPTAK | 0.000 | 0.000 | 0.000 | 0.029 | 0.191 | 0.295 | 0.457 | 0.027 | ||
| 4 spectra, LMVHLVER | 0.000 | 0.000 | 0.107 | 0.128 | 0.041 | 0.359 | 0.365 | 0.000 | ||
| 1 spectrum, GSFGEVYK | 0.000 | 0.000 | 0.000 | 0.000 | 0.000 | 0.509 | 0.481 | 0.010 | ||
| 1 spectrum, ADIWSLGITAIELAK | 0.126 | 0.000 | 0.046 | 0.000 | 0.000 | 0.401 | 0.426 | 0.000 | ||
| 2 spectra, EFVEACLNK | 0.000 | 0.000 | 0.107 | 0.102 | 0.000 | 0.180 | 0.576 | 0.035 | ||
| 2 spectra, TSFLTELIDR | 0.000 | 0.000 | 0.000 | 0.000 | 0.000 | 0.434 | 0.566 | 0.000 |
| Plot | Lyso | Other | |||||||||||
| Expt C |
4 peptides |
7 spectra |
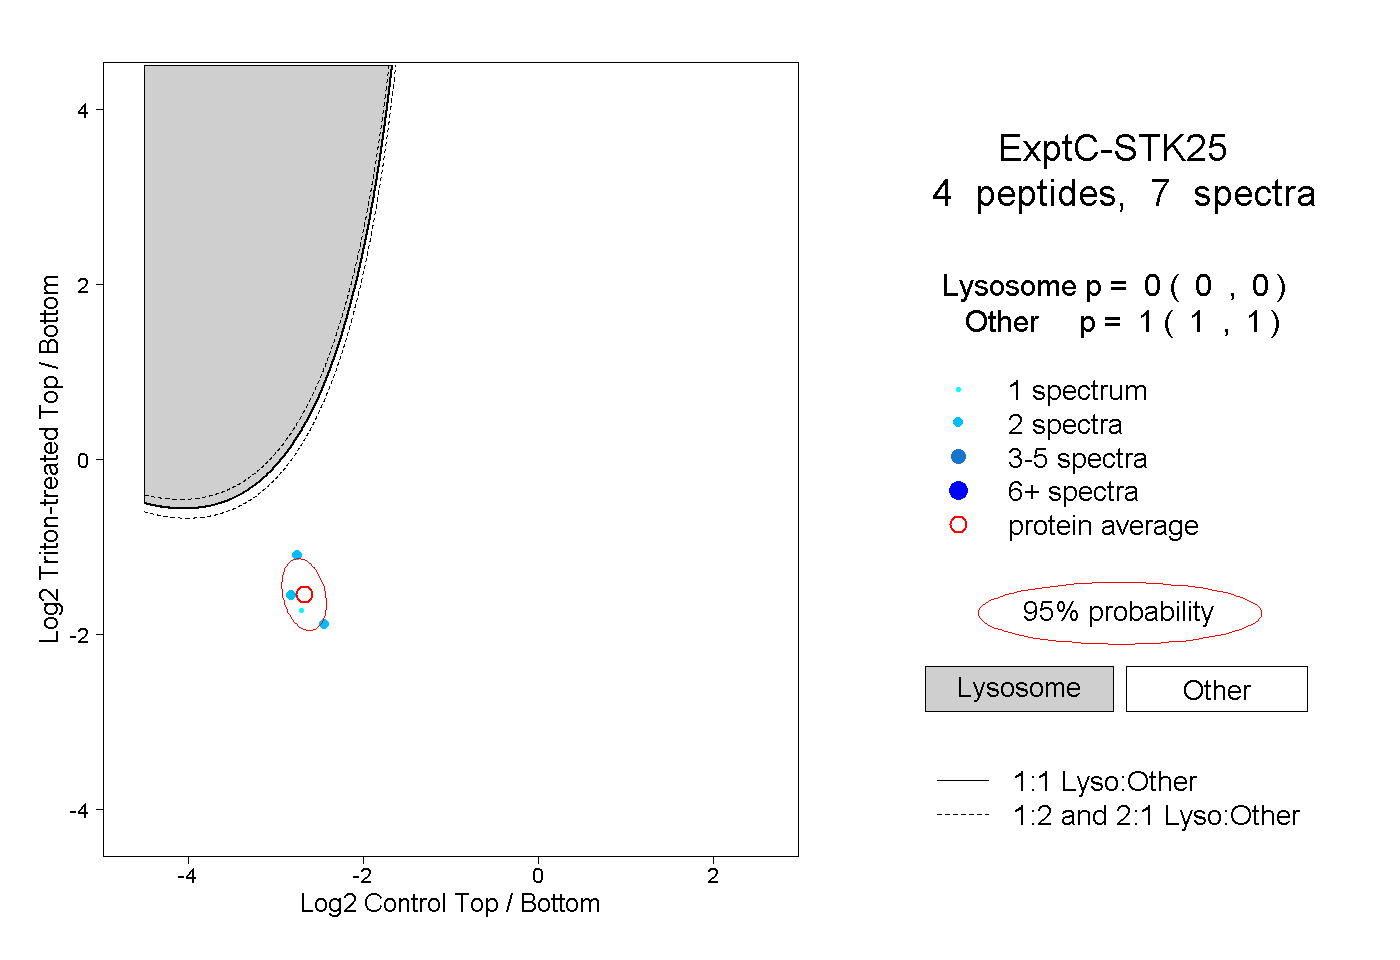 |
0.000 0.000 | 0.000 |
1.000 1.000 | 1.000 |