 2
2peptides
spectra
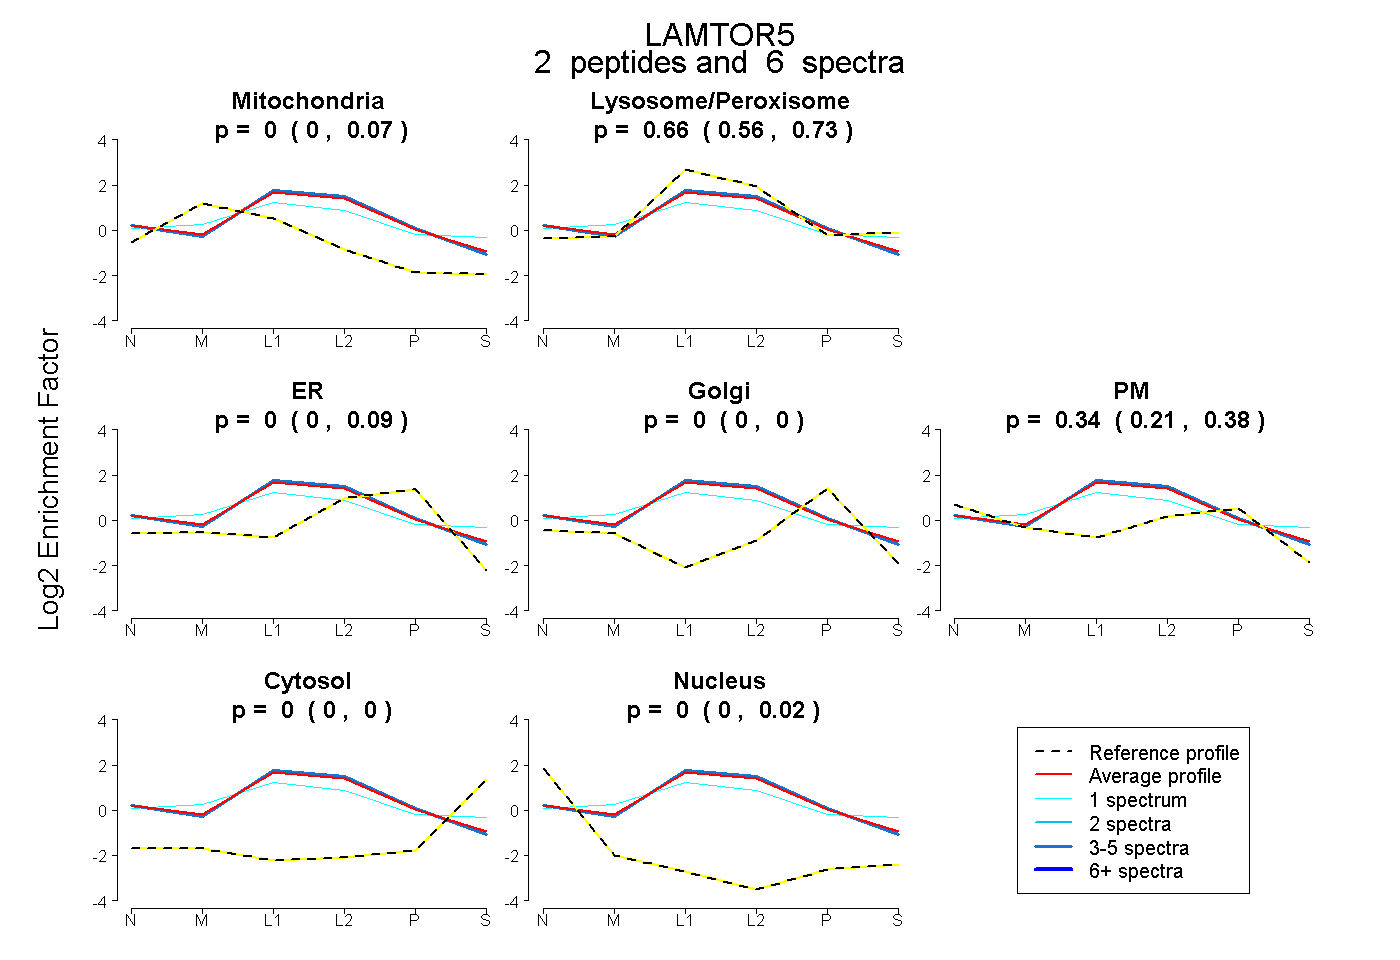
0.000 | 0.068
0.558 | 0.728
0.000 | 0.092
0.000 | 0.000
0.208 | 0.380
0.000 | 0.000
0.000 | 0.016
2peptides
spectra
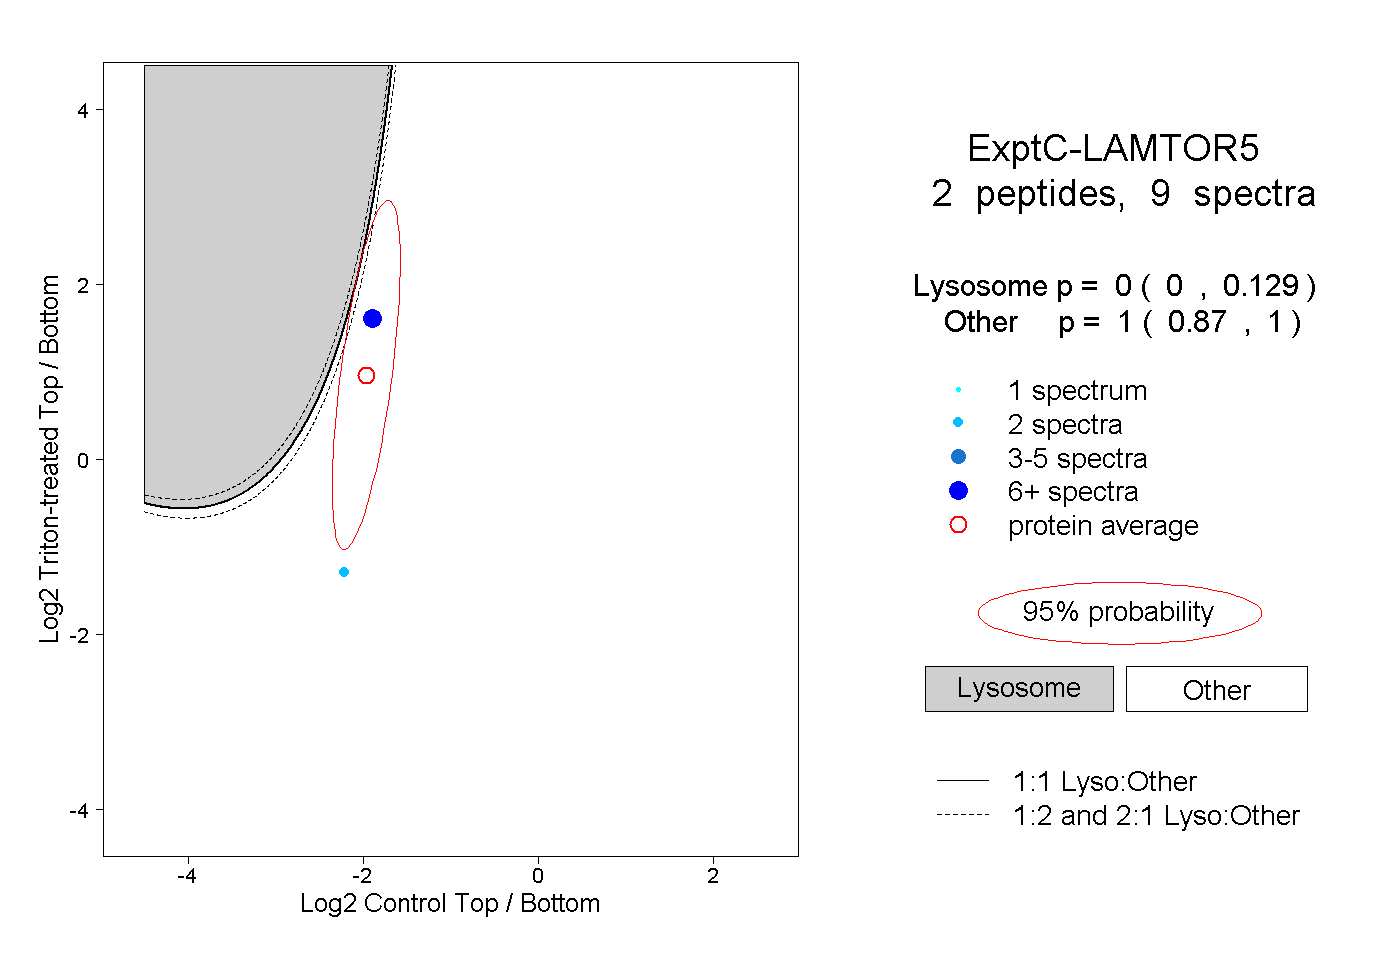
0.000 | 0.129
0.870 | 1.000
1peptide
spectrum
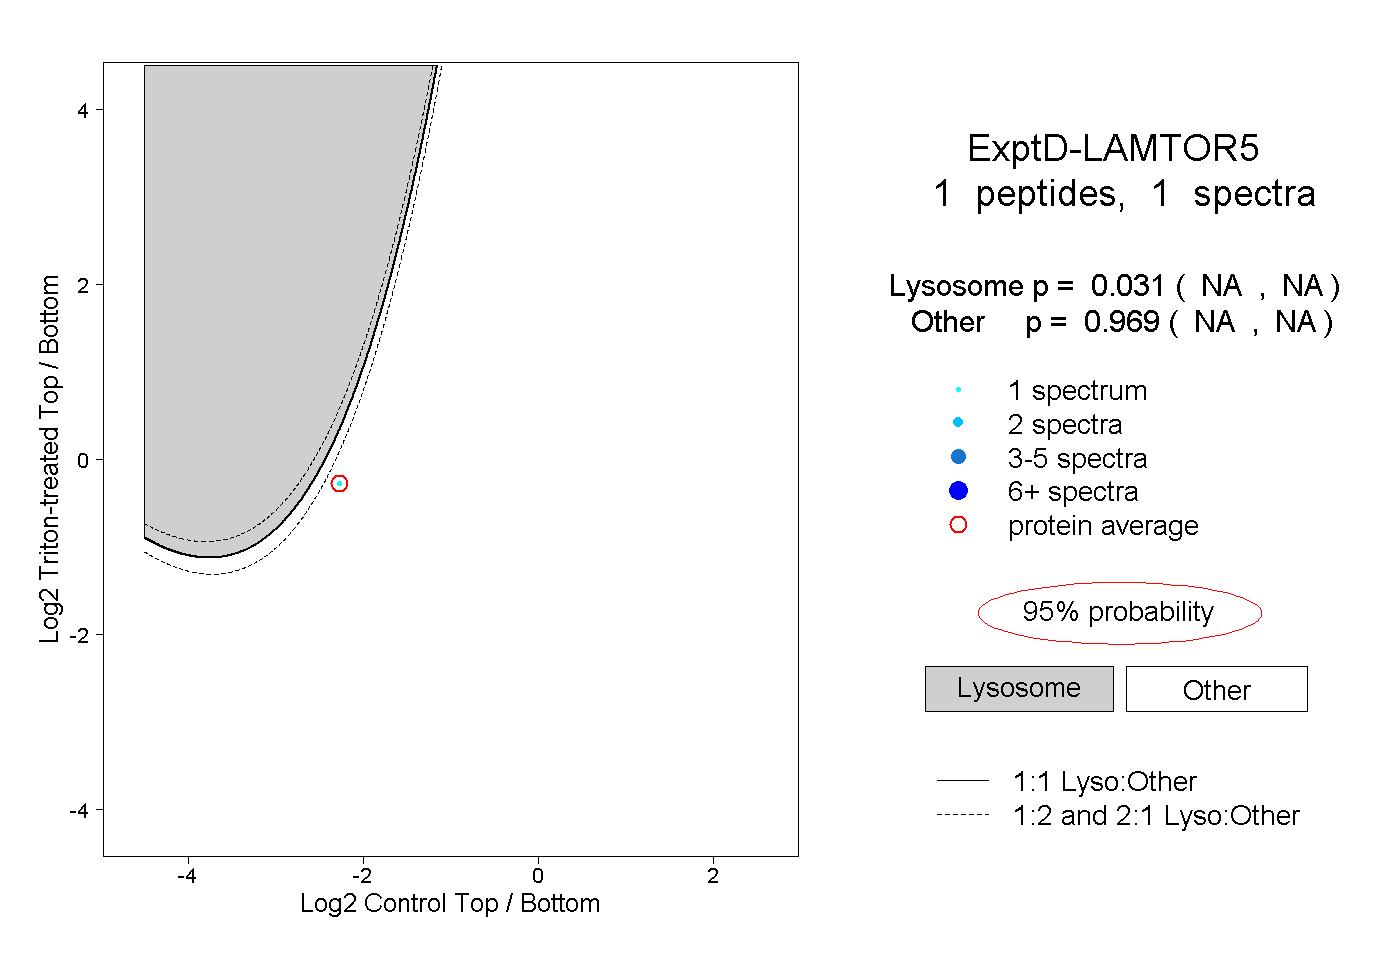
NA | NA
NA | NA