 6
6peptides
spectra
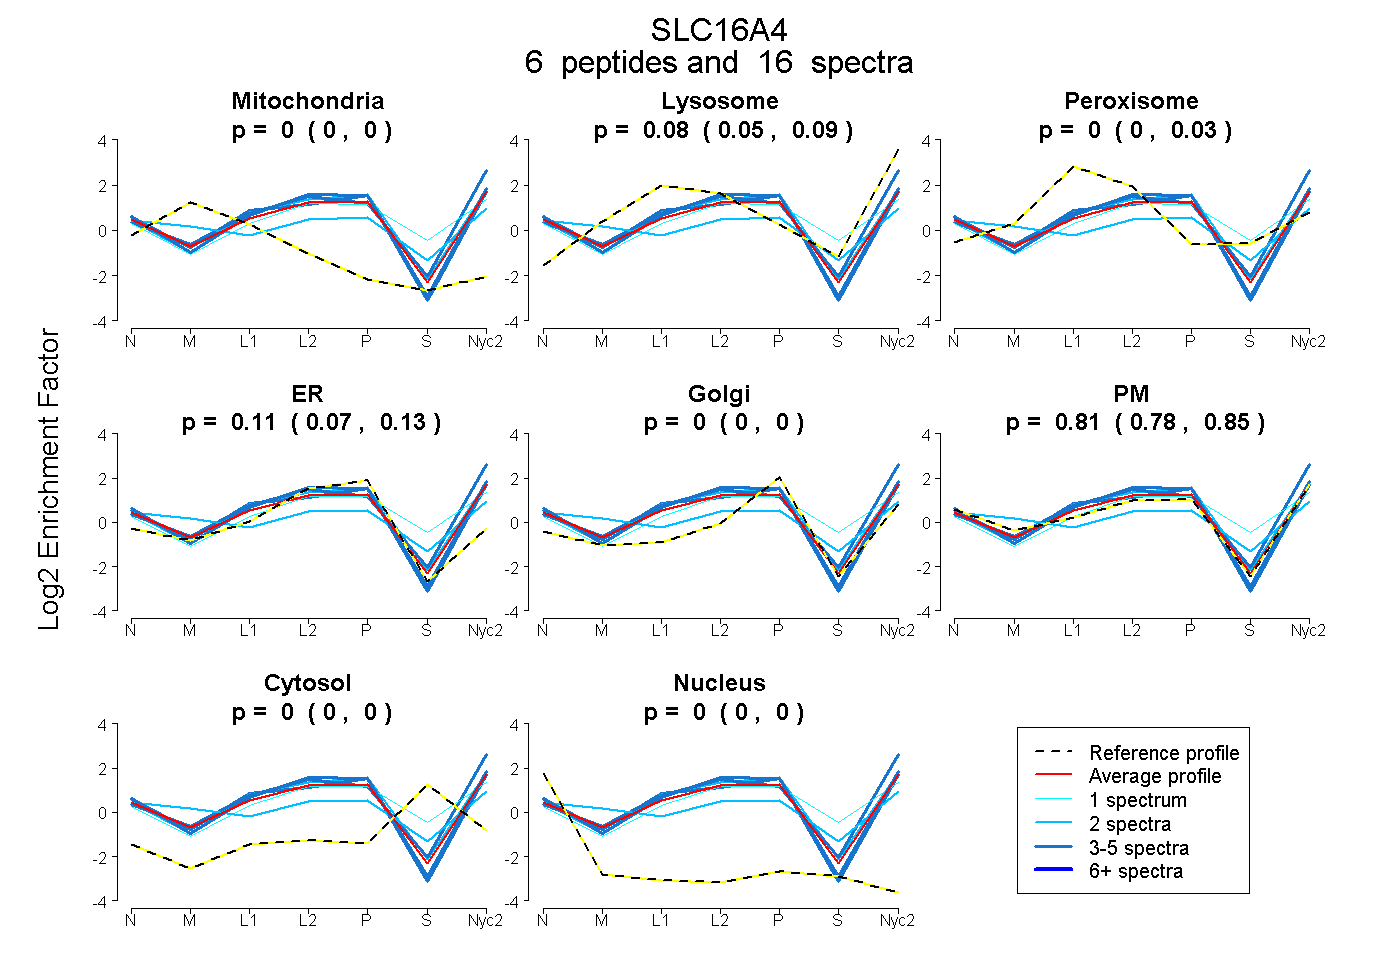
0.000 | 0.000
0.049 | 0.091
0.000 | 0.031
0.070 | 0.135
0.000 | 0.000
0.777 | 0.847
0.000 | 0.000
0.000 | 0.000
1peptide
spectra
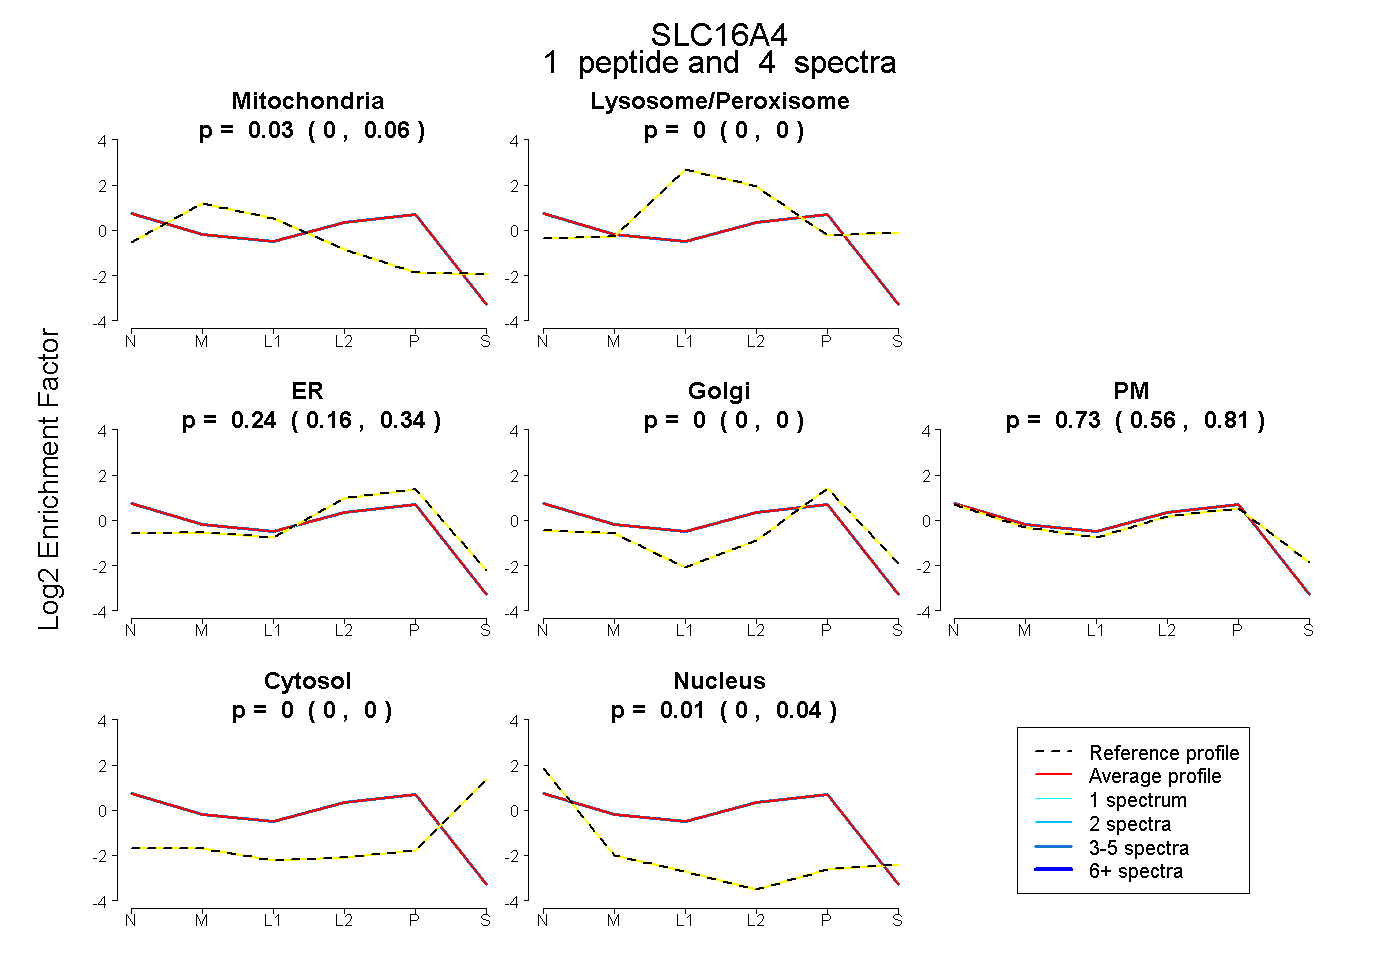
0.000 | 0.057
0.000 | 0.000
0.160 | 0.341
0.000 | 0.000
0.557 | 0.807
0.000 | 0.000
0.000 | 0.043
5peptides
spectra
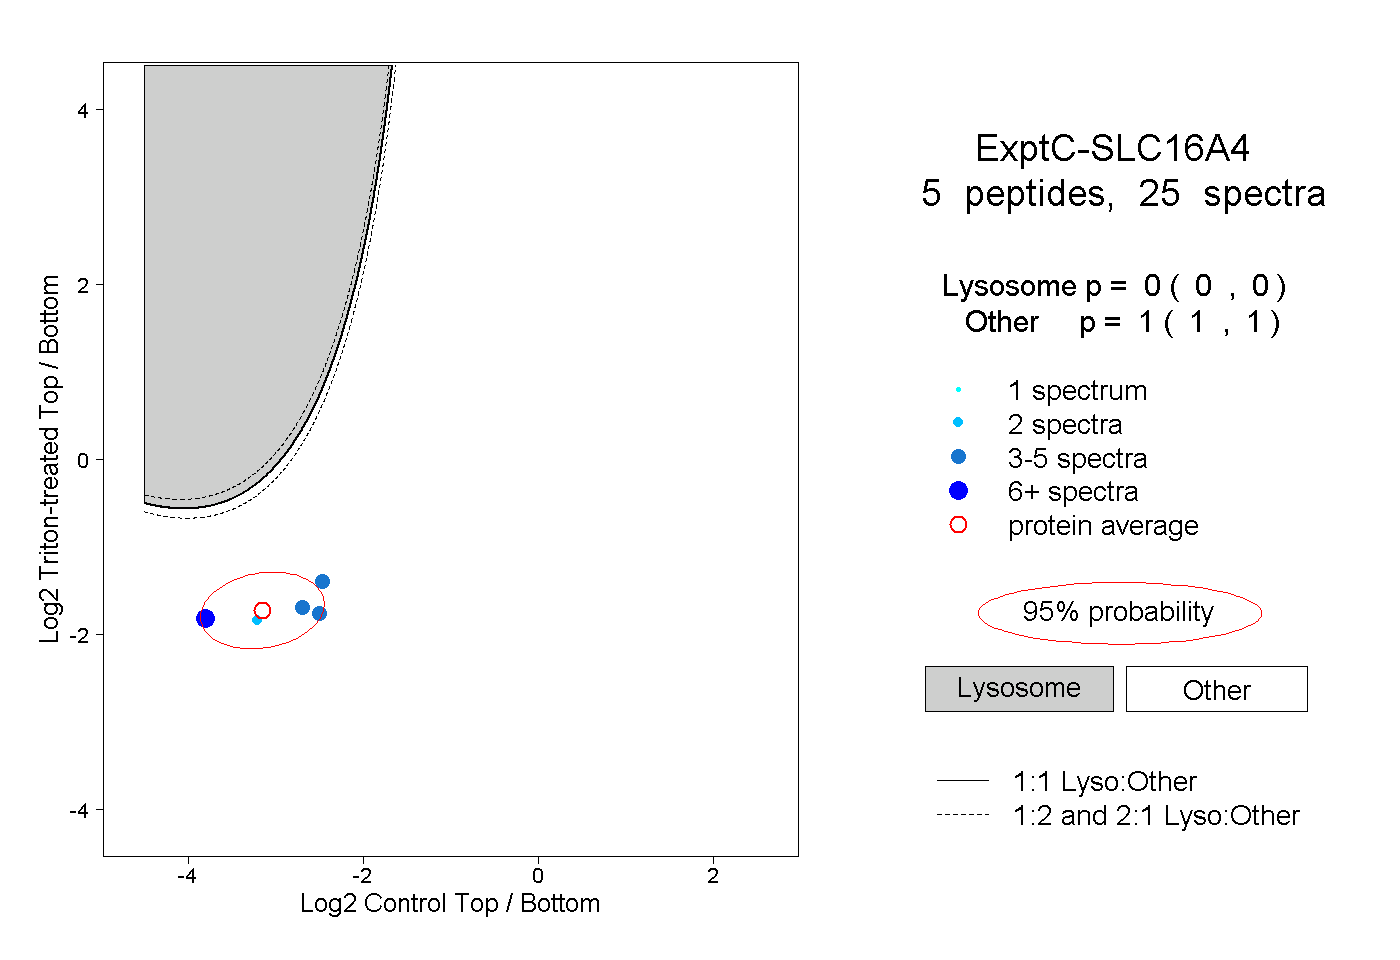
0.000 | 0.000
1.000 | 1.000
2peptides
spectra
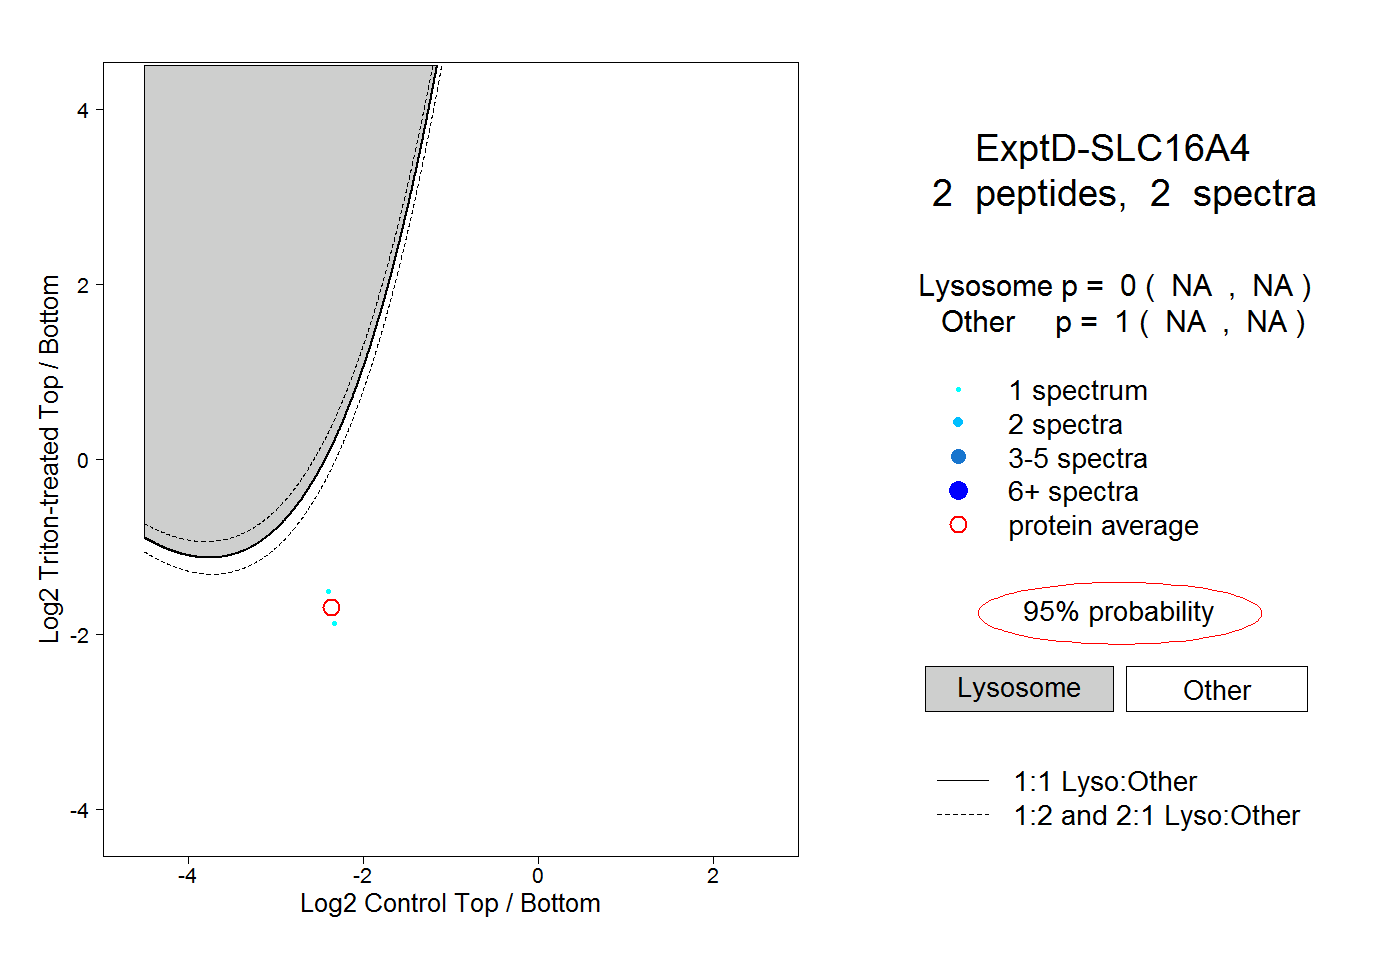
NA | NA
NA | NA