 20
20peptides
spectra
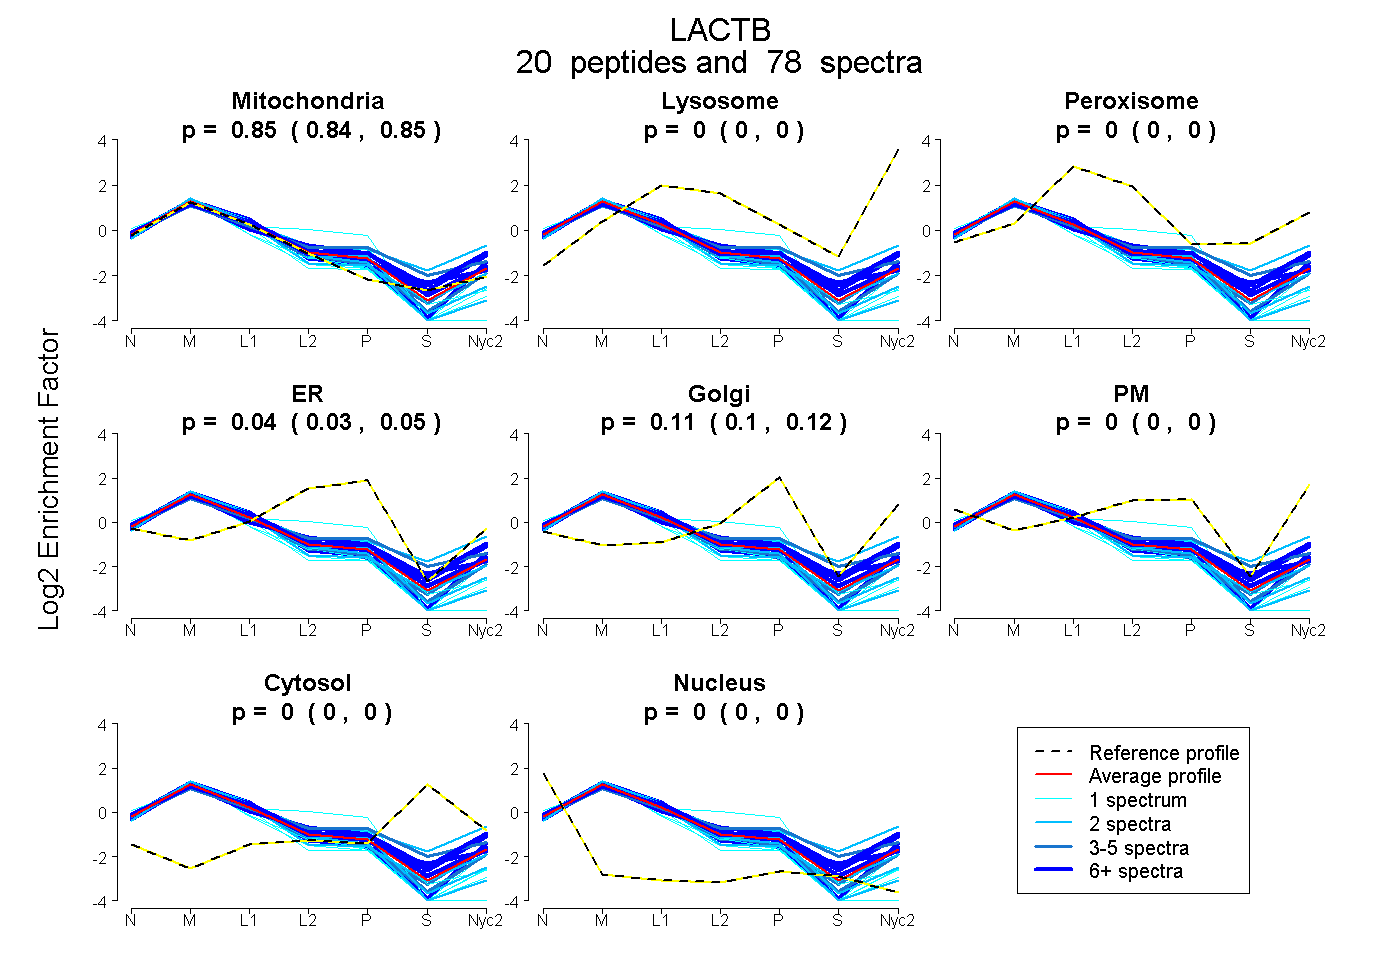
0.845 | 0.851
0.000 | 0.000
0.000 | 0.000
0.032 | 0.046
0.104 | 0.119
0.000 | 0.000
0.000 | 0.000
0.000 | 0.000
15peptides
spectra
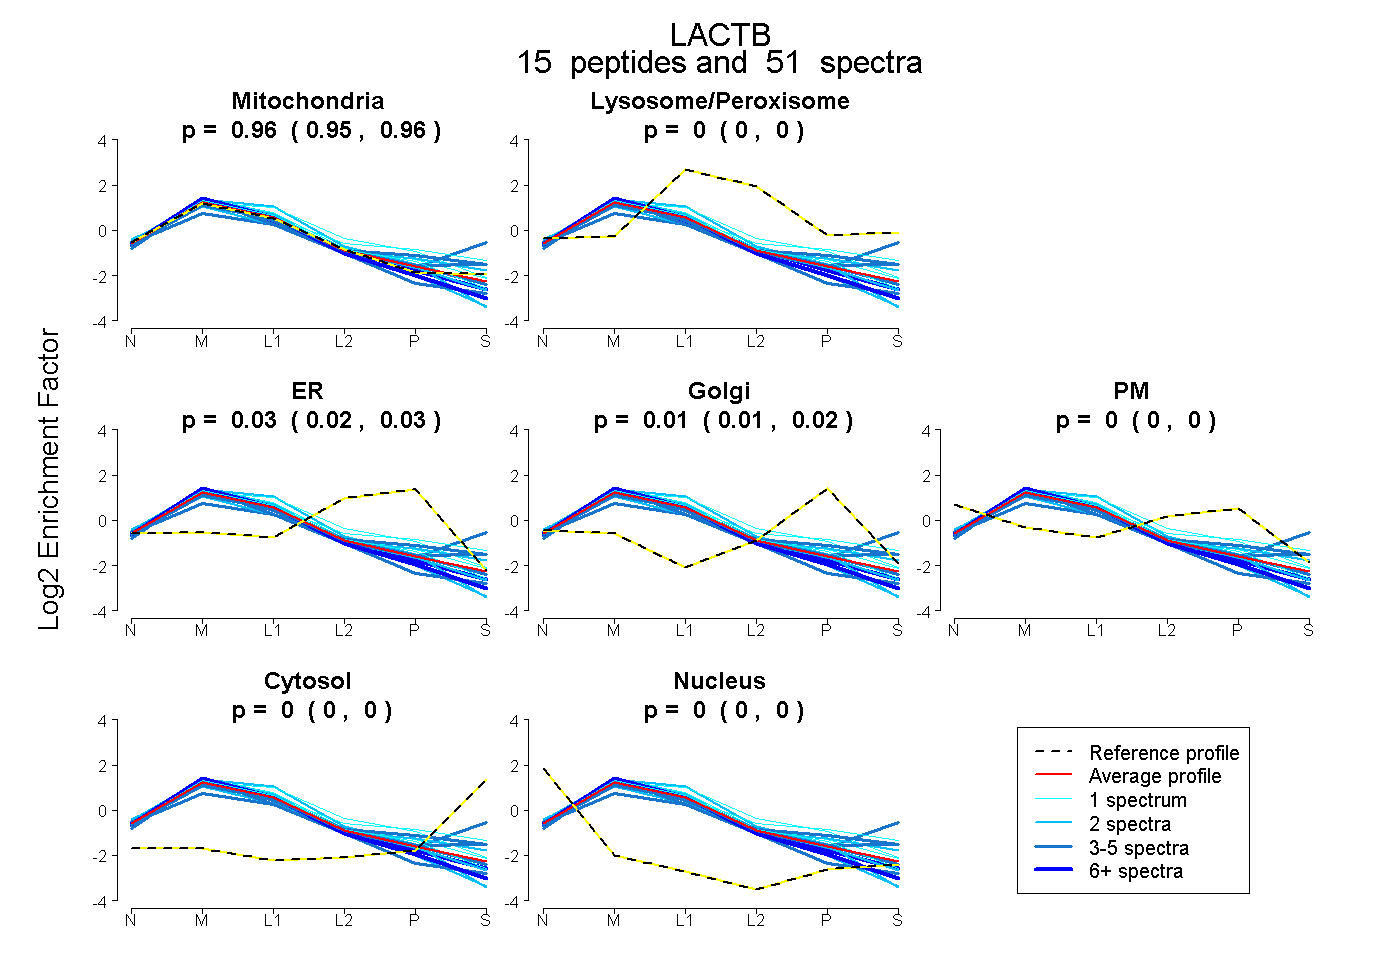
0.954 | 0.964
0.000 | 0.000
0.020 | 0.034
0.006 | 0.018
0.000 | 0.000
0.000 | 0.000
0.000 | 0.000
22peptides
spectra
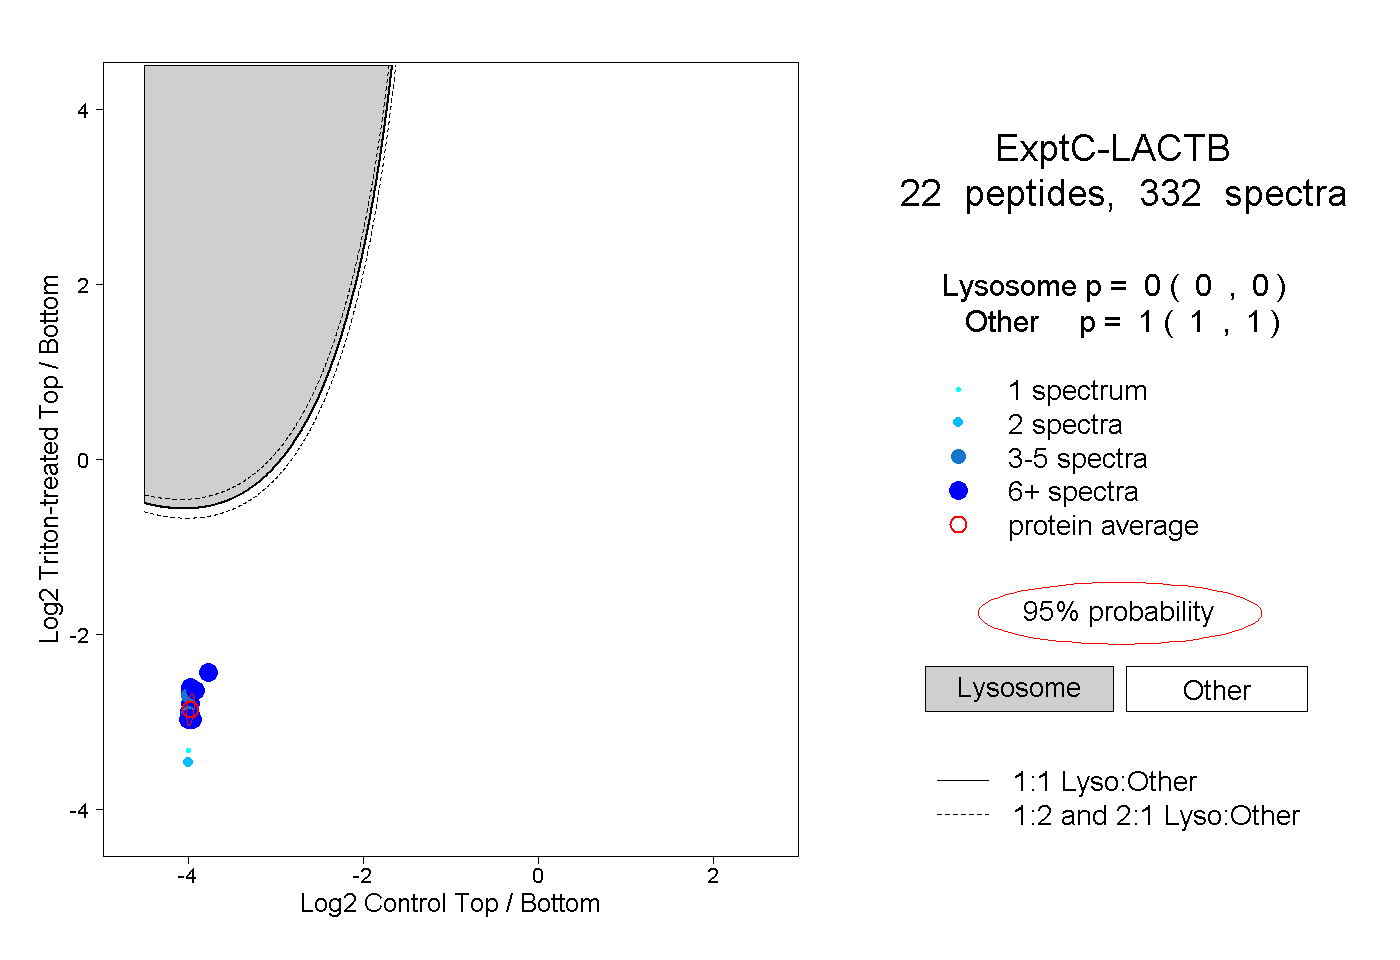
0.000 | 0.000
1.000 | 1.000
12peptides
spectra
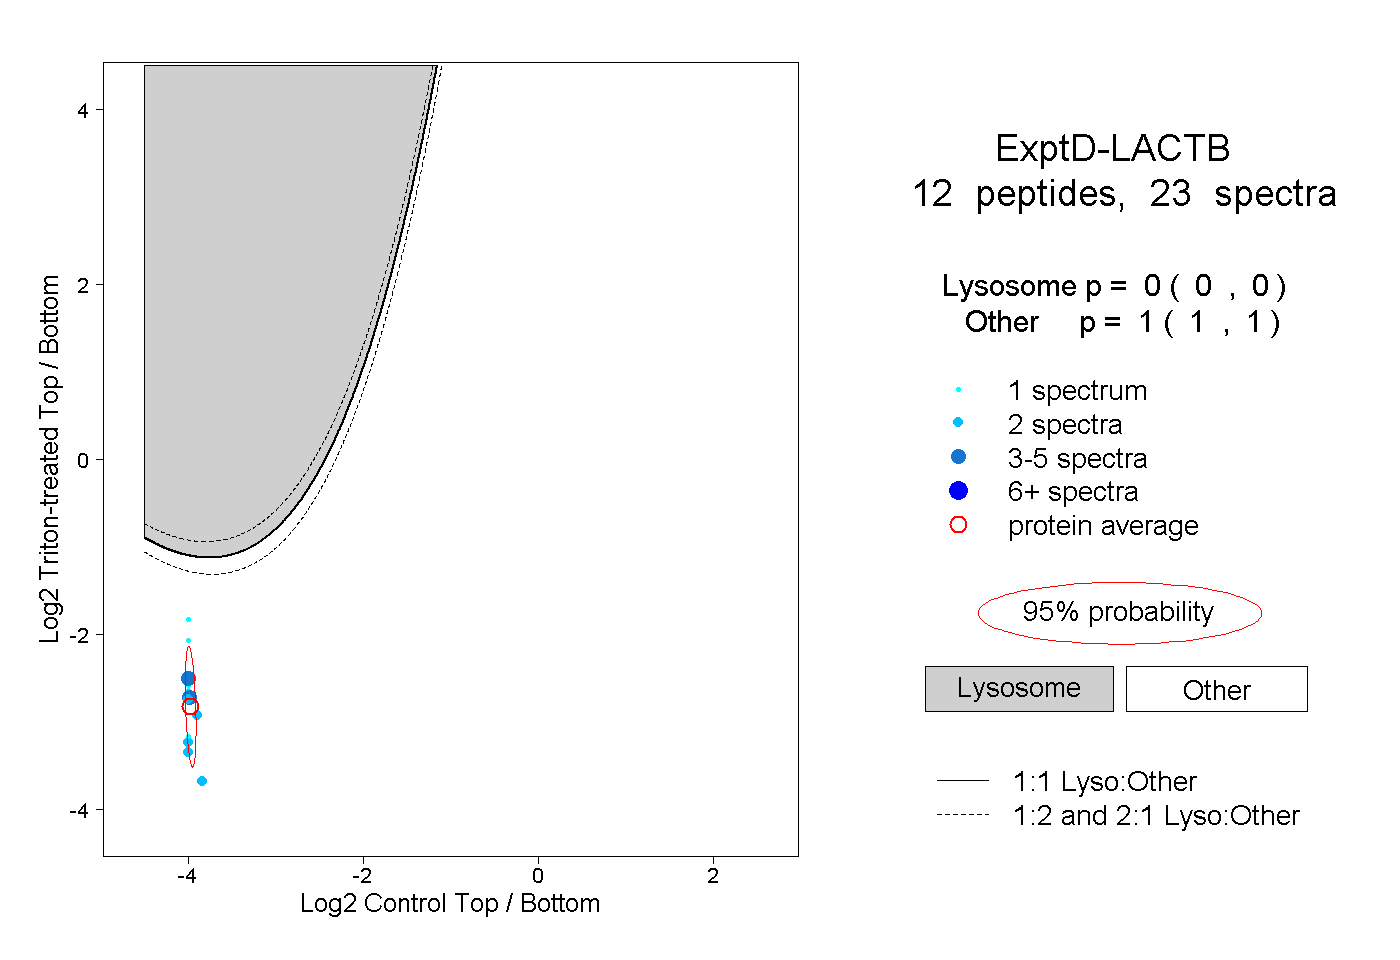
0.000 | 0.000
1.000 | 1.000