 15
15peptides
spectra
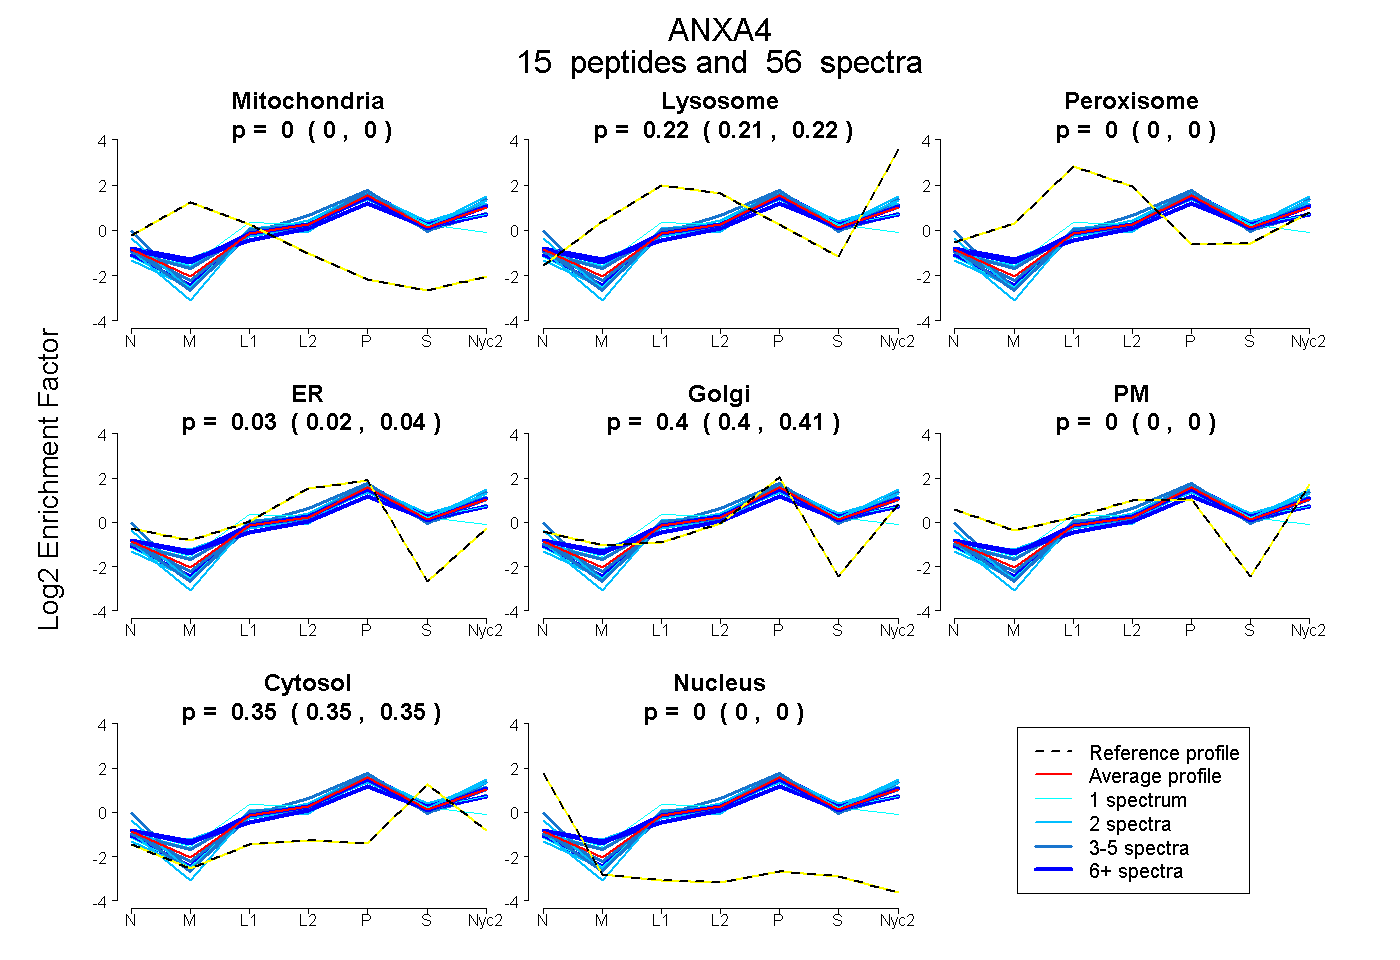
0.000 | 0.000
0.215 | 0.222
0.000 | 0.000
0.023 | 0.035
0.396 | 0.408
0.000 | 0.000
0.347 | 0.352
0.000 | 0.000
12peptides
spectra
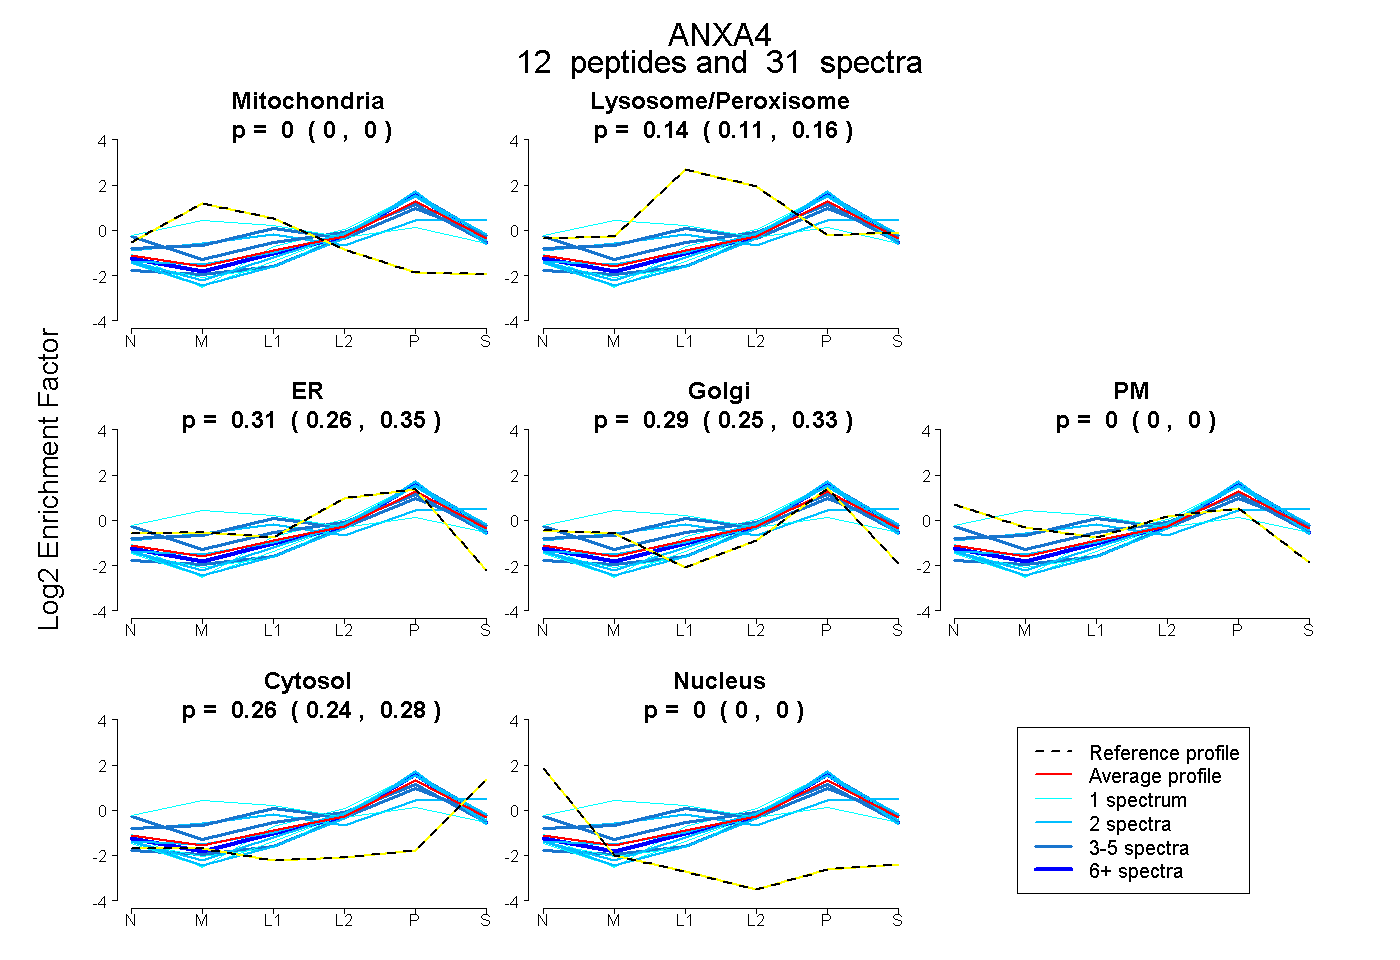
0.000 | 0.000
0.112 | 0.157
0.255 | 0.351
0.247 | 0.333
0.000 | 0.000
0.244 | 0.278
0.000 | 0.000
16peptides
spectra
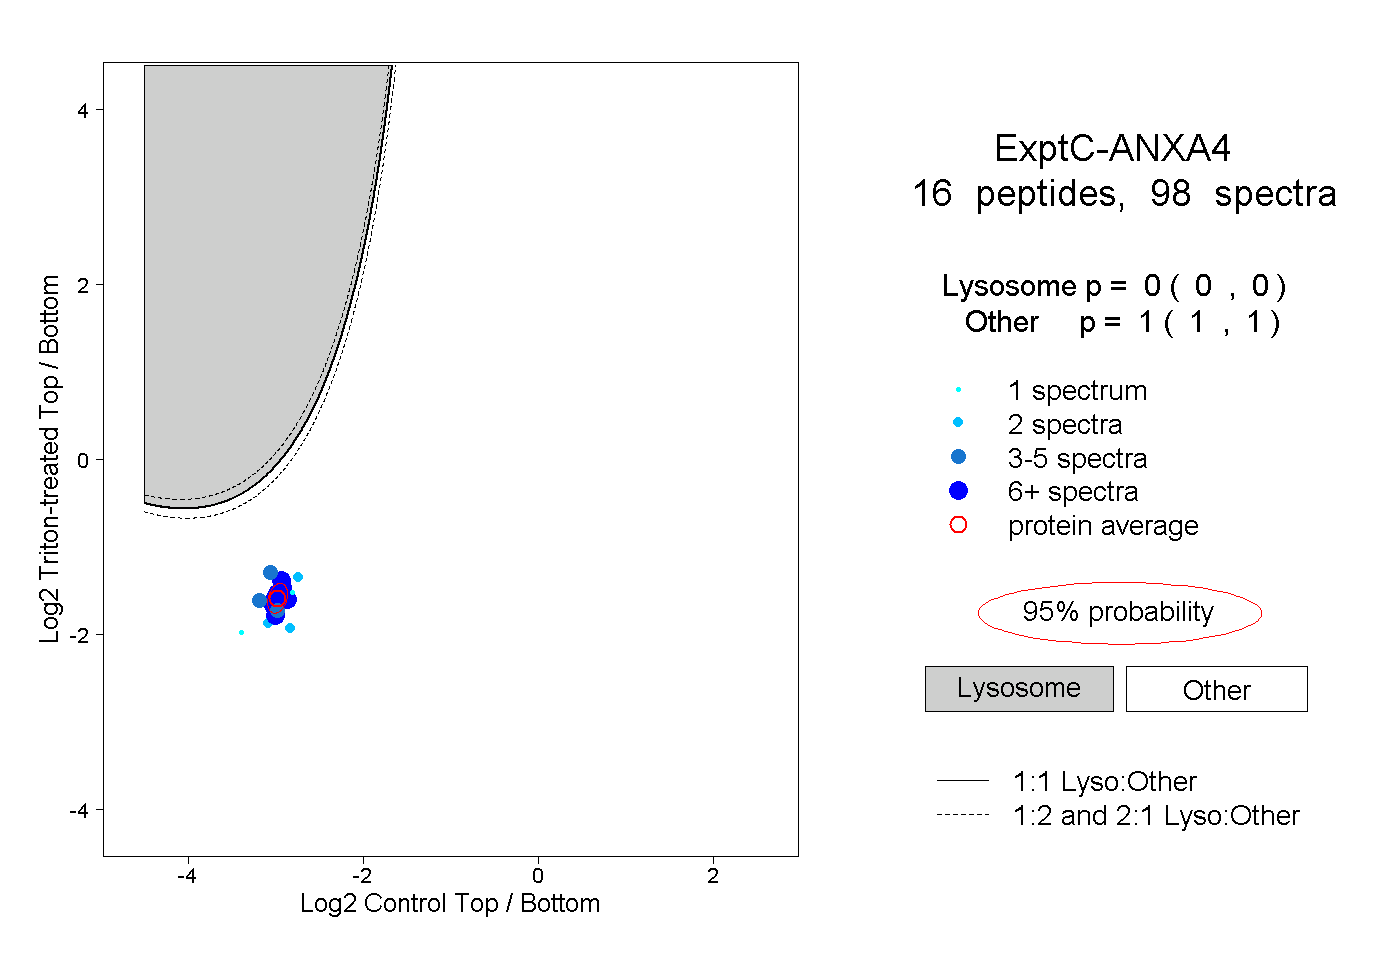
0.000 | 0.000
1.000 | 1.000
8peptides
spectra
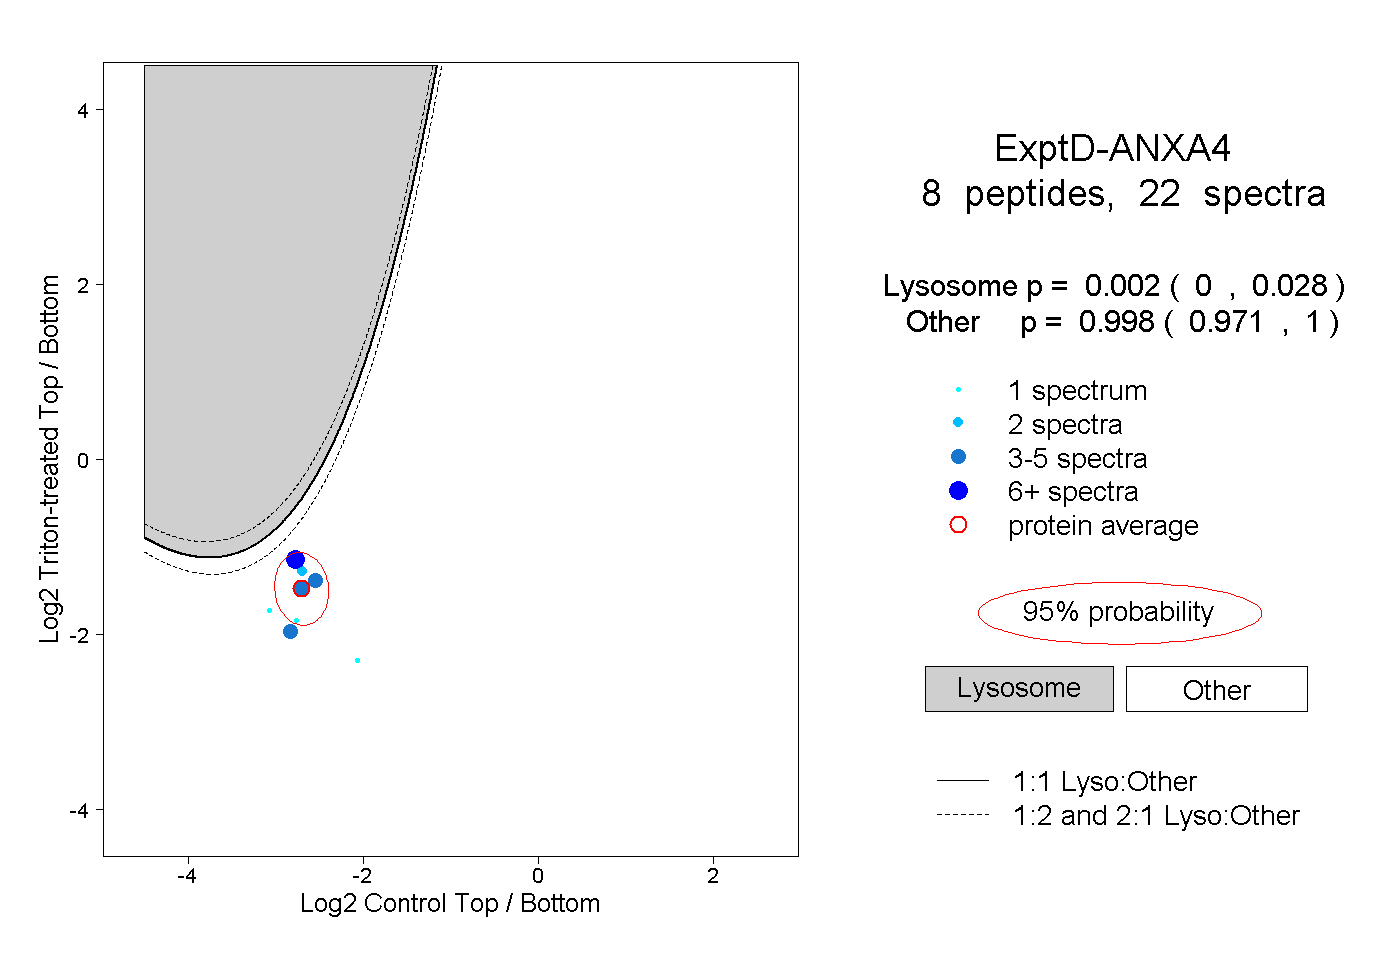
0.000 | 0.028
0.971 | 1.000