21
21peptides
spectra
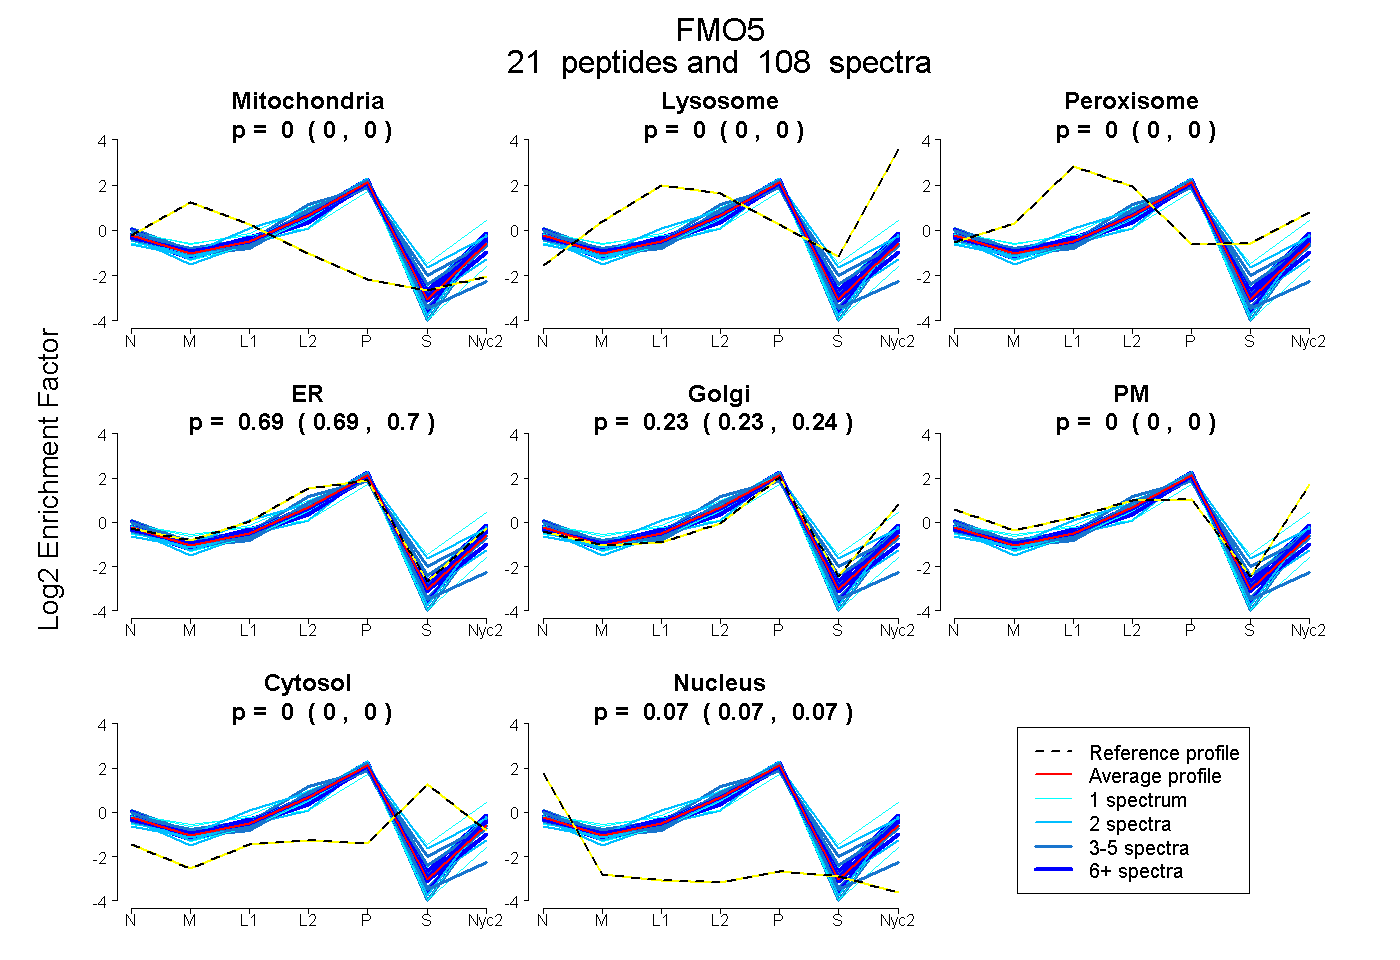
0.000 | 0.000
0.000 | 0.000
0.000 | 0.000
0.686 | 0.699
0.226 | 0.241
0.000 | 0.000
0.000 | 0.000
0.071 | 0.075
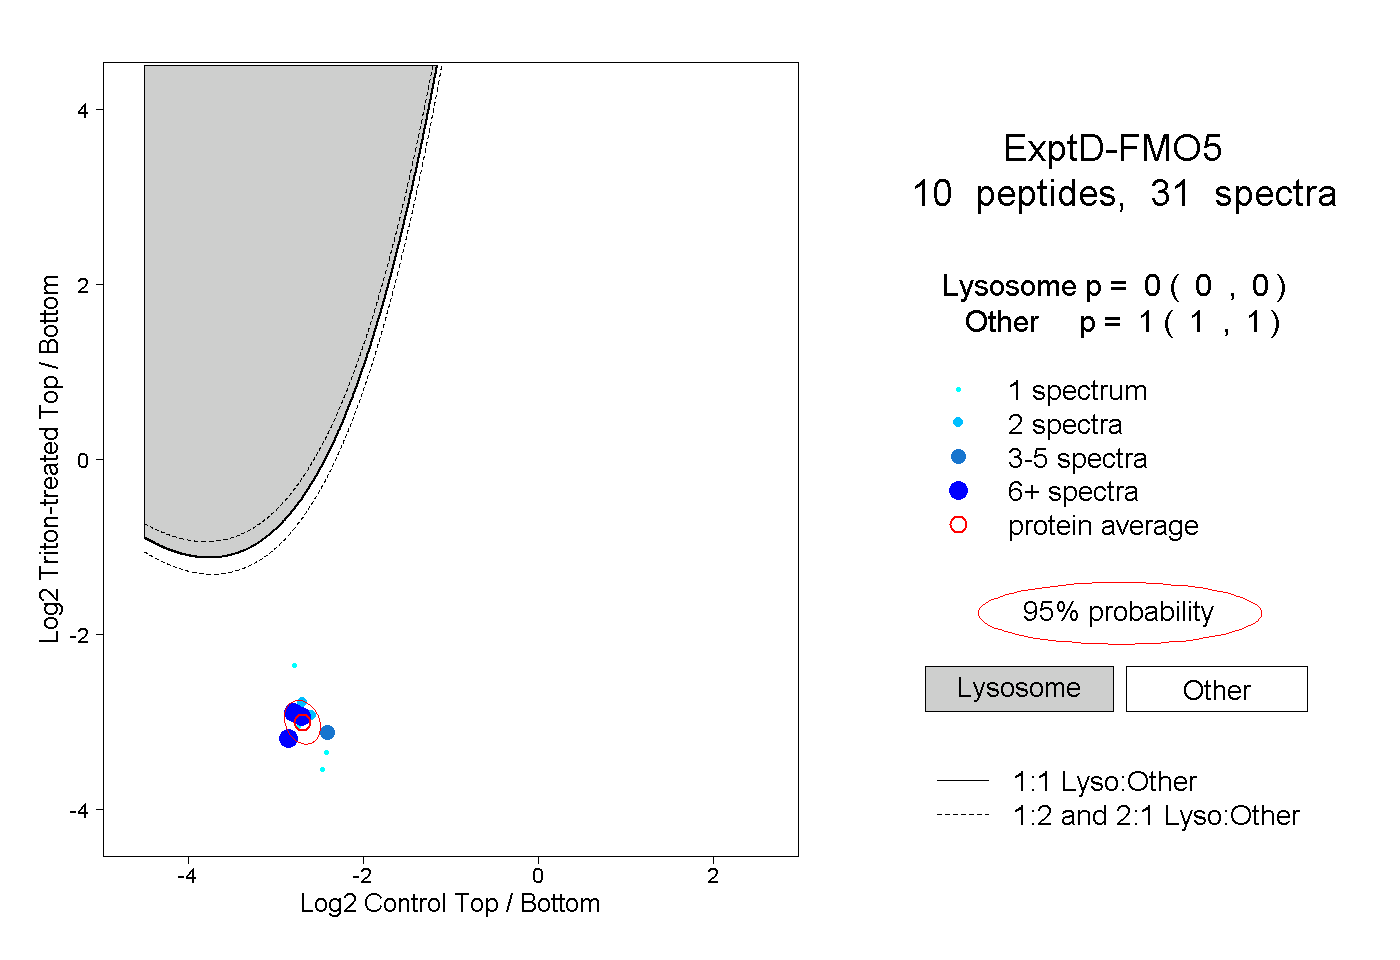
12peptides
spectra
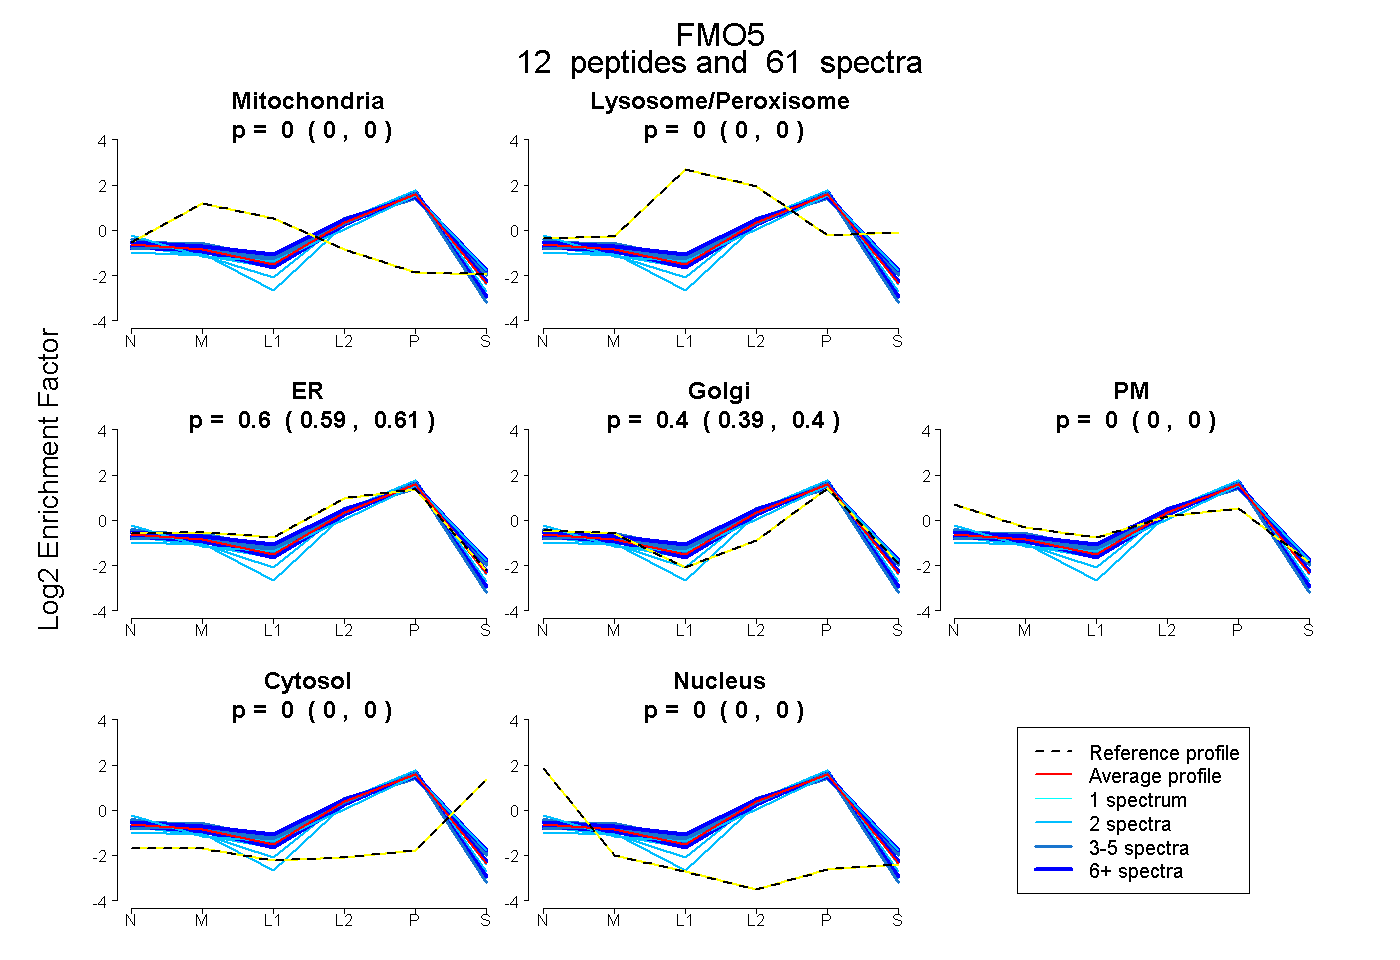
0.000 | 0.000
0.000 | 0.000
0.594 | 0.609
0.390 | 0.405
0.000 | 0.000
0.000 | 0.000
0.000 | 0.000