 21
21peptides
spectra
0.000 | 0.000
0.000 | 0.000
0.000 | 0.000
0.686 | 0.699
0.226 | 0.241
0.000 | 0.000
0.000 | 0.000
0.071 | 0.075
| Plot | Mito | Lyso | Perox | ER | Golgi | PM | Cytosol | Nucleus | |||||
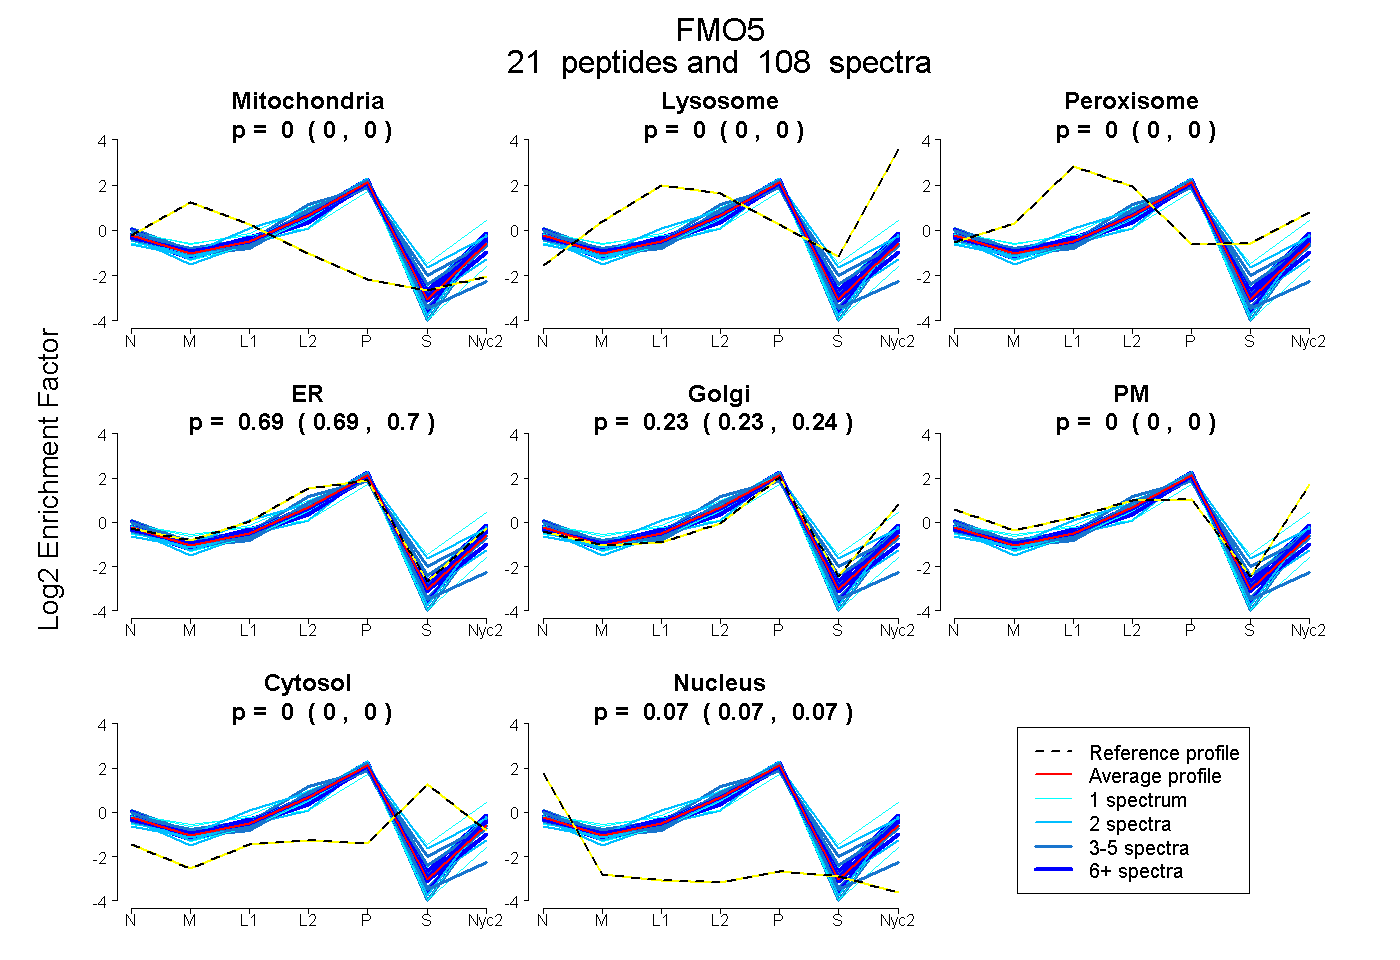
| Expt A |
21 peptides |
108 spectra |
|
0.000 0.000 | 0.000 |
0.000 0.000 | 0.000 |
0.000 0.000 | 0.000 |
0.693 0.686 | 0.699 |
0.235 0.226 | 0.241 |
0.000 0.000 | 0.000 |
0.000 0.000 | 0.000 |
0.073 0.071 | 0.075 |
| 13 spectra, YVDSQR | 0.000 | 0.000 | 0.000 | 0.640 | 0.305 | 0.000 | 0.000 | 0.054 | ||
| 4 spectra, TILTTEDR | 0.000 | 0.000 | 0.000 | 0.695 | 0.176 | 0.000 | 0.073 | 0.056 | ||
| 1 spectrum, QPDFSTSGQWQVVTEHEGK | 0.000 | 0.000 | 0.000 | 0.456 | 0.492 | 0.000 | 0.000 | 0.052 | ||
| 18 spectra, QVFLSTR | 0.000 | 0.000 | 0.000 | 0.693 | 0.257 | 0.000 | 0.000 | 0.050 | ||
| 1 spectrum, HSALGQHPTINDDLPNR | 0.005 | 0.000 | 0.175 | 0.008 | 0.755 | 0.000 | 0.057 | 0.000 | ||
| 3 spectra, LQGPGK | 0.000 | 0.000 | 0.000 | 0.668 | 0.230 | 0.000 | 0.000 | 0.103 | ||
| 12 spectra, KPLMTR | 0.000 | 0.000 | 0.000 | 0.701 | 0.165 | 0.000 | 0.000 | 0.135 | ||
| 2 spectra, FDHEMFGLKPK | 0.000 | 0.000 | 0.000 | 0.572 | 0.301 | 0.000 | 0.000 | 0.126 | ||
| 2 spectra, SVIINTSK | 0.000 | 0.000 | 0.000 | 0.656 | 0.303 | 0.000 | 0.000 | 0.040 | ||
| 15 spectra, GAWILNR | 0.000 | 0.000 | 0.000 | 0.659 | 0.301 | 0.000 | 0.000 | 0.040 | ||
| 2 spectra, IAVIGSGASGLTCIK | 0.000 | 0.000 | 0.000 | 0.818 | 0.077 | 0.000 | 0.000 | 0.105 | ||
| 3 spectra, IISGLVK | 0.000 | 0.000 | 0.000 | 0.797 | 0.153 | 0.002 | 0.000 | 0.048 | ||
| 4 spectra, WATQVFK | 0.000 | 0.000 | 0.000 | 0.720 | 0.210 | 0.000 | 0.007 | 0.063 | ||
| 5 spectra, EFGLLK | 0.000 | 0.000 | 0.000 | 0.724 | 0.211 | 0.000 | 0.000 | 0.065 | ||
| 2 spectra, VSLYK | 0.000 | 0.000 | 0.000 | 0.796 | 0.184 | 0.000 | 0.000 | 0.020 | ||
| 4 spectra, TTVCSVK | 0.000 | 0.000 | 0.000 | 0.851 | 0.000 | 0.000 | 0.000 | 0.149 | ||
| 10 spectra, HGYPIDILLSSR | 0.000 | 0.000 | 0.000 | 0.547 | 0.408 | 0.000 | 0.000 | 0.045 | ||
| 2 spectra, NPVEFTGK | 0.000 | 0.000 | 0.000 | 0.523 | 0.335 | 0.000 | 0.142 | 0.000 | ||
| 3 spectra, DSSGTSLVTVR | 0.000 | 0.000 | 0.000 | 0.561 | 0.370 | 0.000 | 0.000 | 0.069 | ||
| 1 spectrum, ITNYLSK | 0.001 | 0.000 | 0.000 | 0.863 | 0.104 | 0.000 | 0.000 | 0.033 | ||
| 1 spectrum, ICGSALK | 0.000 | 0.000 | 0.000 | 0.883 | 0.000 | 0.000 | 0.000 | 0.117 |
| Plot | Mito | Lyso or Perox | ER | Golgi | PM | Cytosol | Nucleus | ||||||
| Expt B |
12 peptides |
61 spectra |
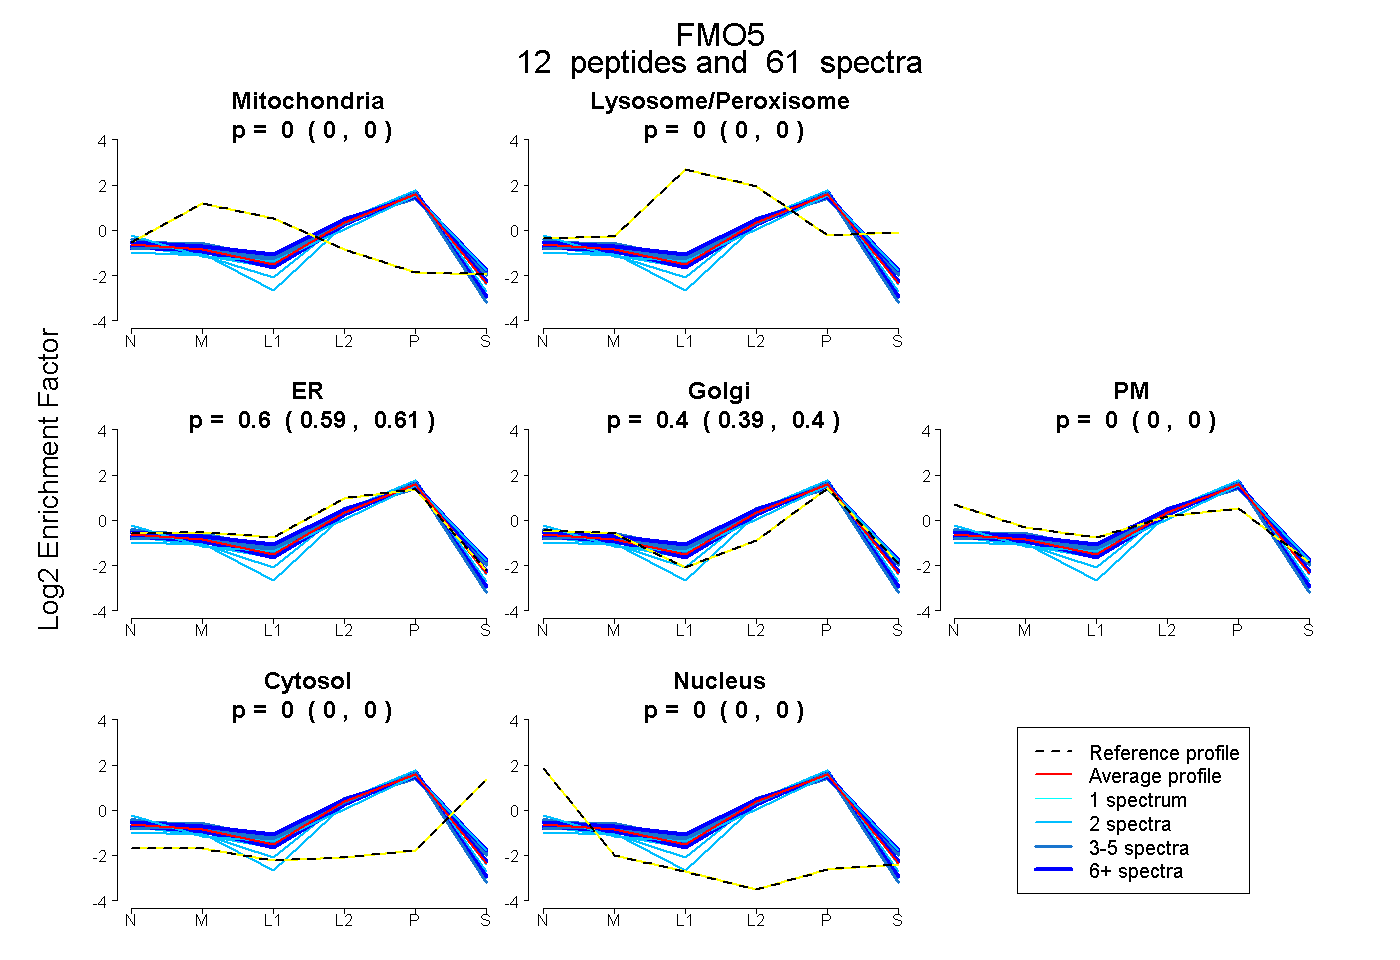 |
0.000 0.000 | 0.000 |
0.000 0.000 | 0.000 |
0.602 0.594 | 0.609 |
0.398 0.390 | 0.405 |
0.000 0.000 | 0.000 |
0.000 0.000 | 0.000 |
0.000 0.000 | 0.000 |
|||
| Plot | Lyso | Other | |||||||||||
| Expt C |
20 peptides |
213 spectra |
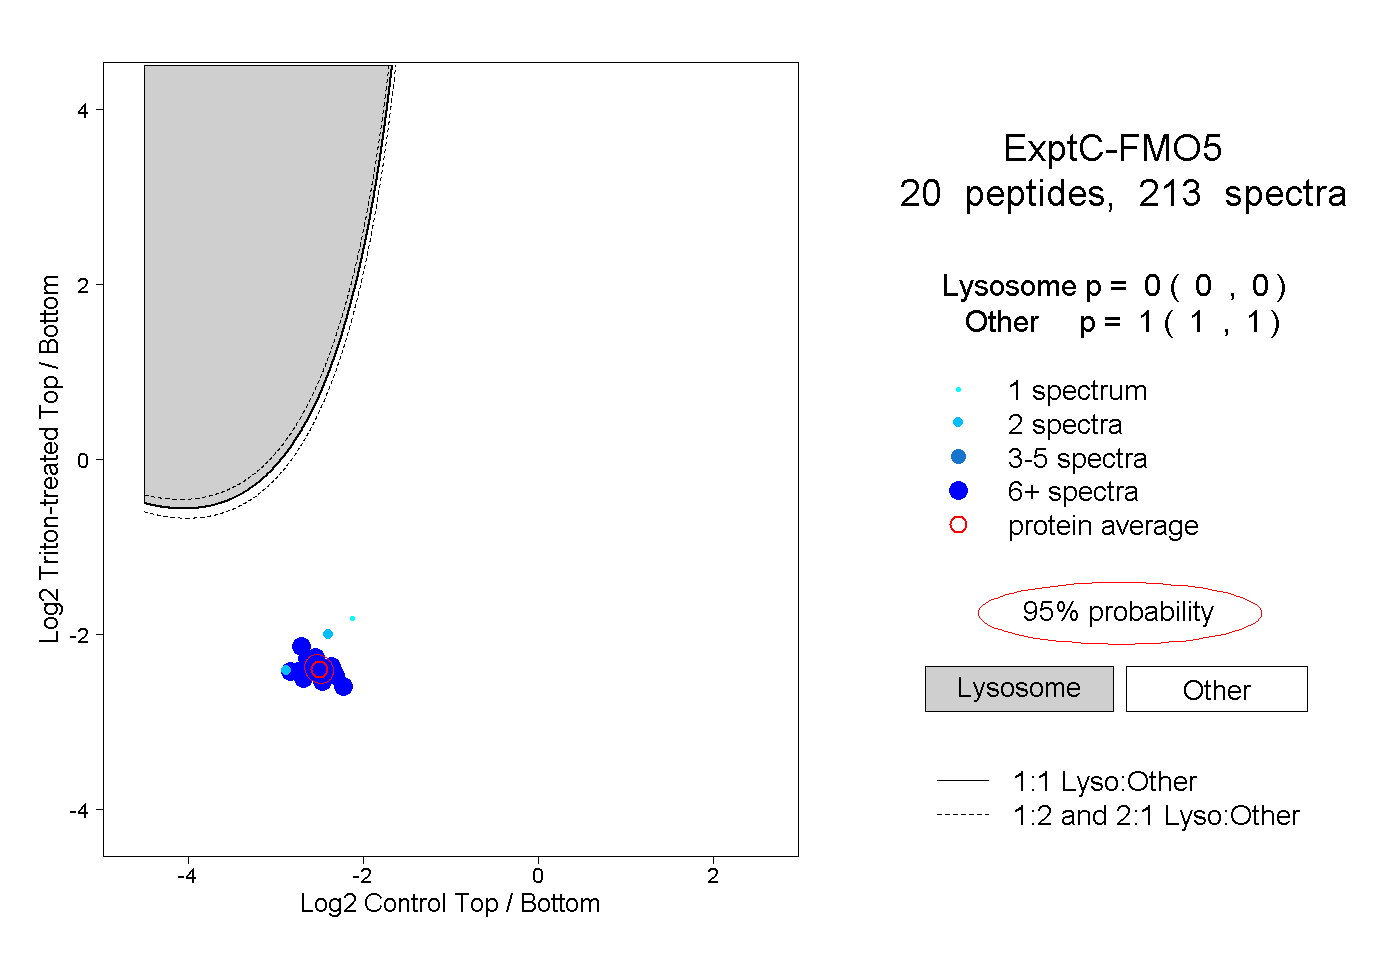 |
0.000 0.000 | 0.000 |
1.000 1.000 | 1.000 |
||||||||
| Plot | Lyso | Other | |||||||||||
| Expt D |
10 peptides |
31 spectra |
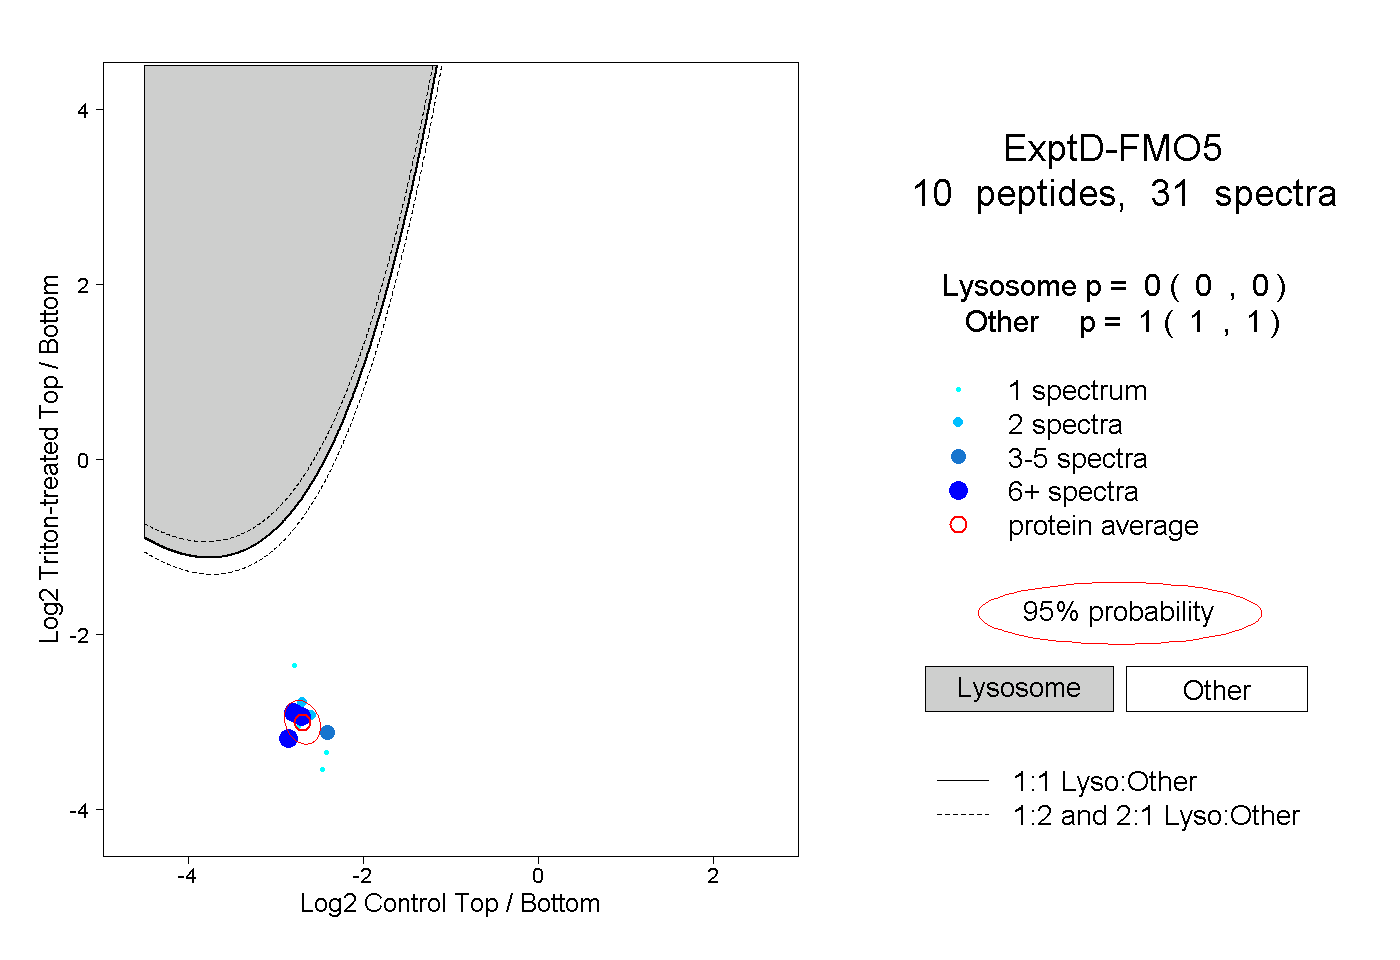 |
0.000 0.000 | 0.000 |
1.000 1.000 | 1.000 |