 2
2peptides
spectra
0.000 | 0.000
0.725 | 0.936
0.000 | 0.149
0.000 | 0.000
0.000 | 0.000
0.004 | 0.149
0.000 | 0.000
0.000 | 0.000
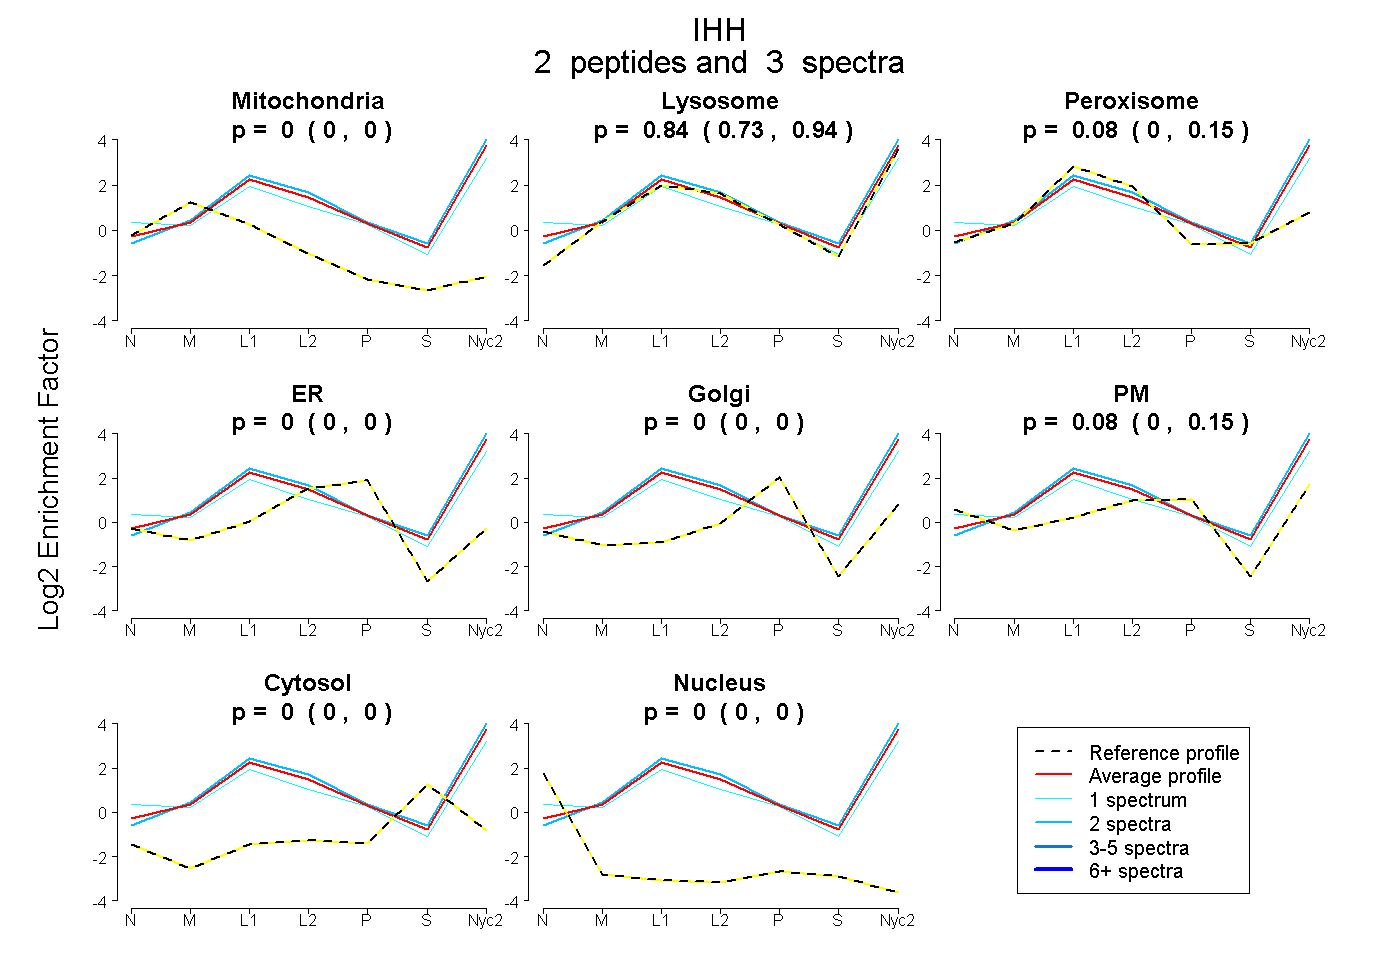
| Plot | Mito | Lyso | Perox | ER | Golgi | PM | Cytosol | Nucleus | |||||
| Expt A |
2 peptides |
3 spectra |
|
0.000 0.000 | 0.000 |
0.839 0.725 | 0.936 |
0.077 0.000 | 0.149 |
0.000 0.000 | 0.000 |
0.000 0.000 | 0.000 |
0.083 0.004 | 0.149 |
0.000 0.000 | 0.000 |
0.000 0.000 | 0.000 |
| 1 spectrum, AFQVIETQDPPR | 0.000 | 0.546 | 0.130 | 0.000 | 0.000 | 0.324 | 0.000 | 0.000 | ||
| 2 spectra, VALSAVKPGDR | 0.000 | 0.963 | 0.037 | 0.000 | 0.000 | 0.000 | 0.000 | 0.000 |