 3
3peptides
spectra
0.000 | 0.034
0.000 | 0.516
0.000 | 0.418
0.000 | 0.292
0.000 | 0.429
0.000 | 0.620
0.025 | 0.266
0.000 | 0.066
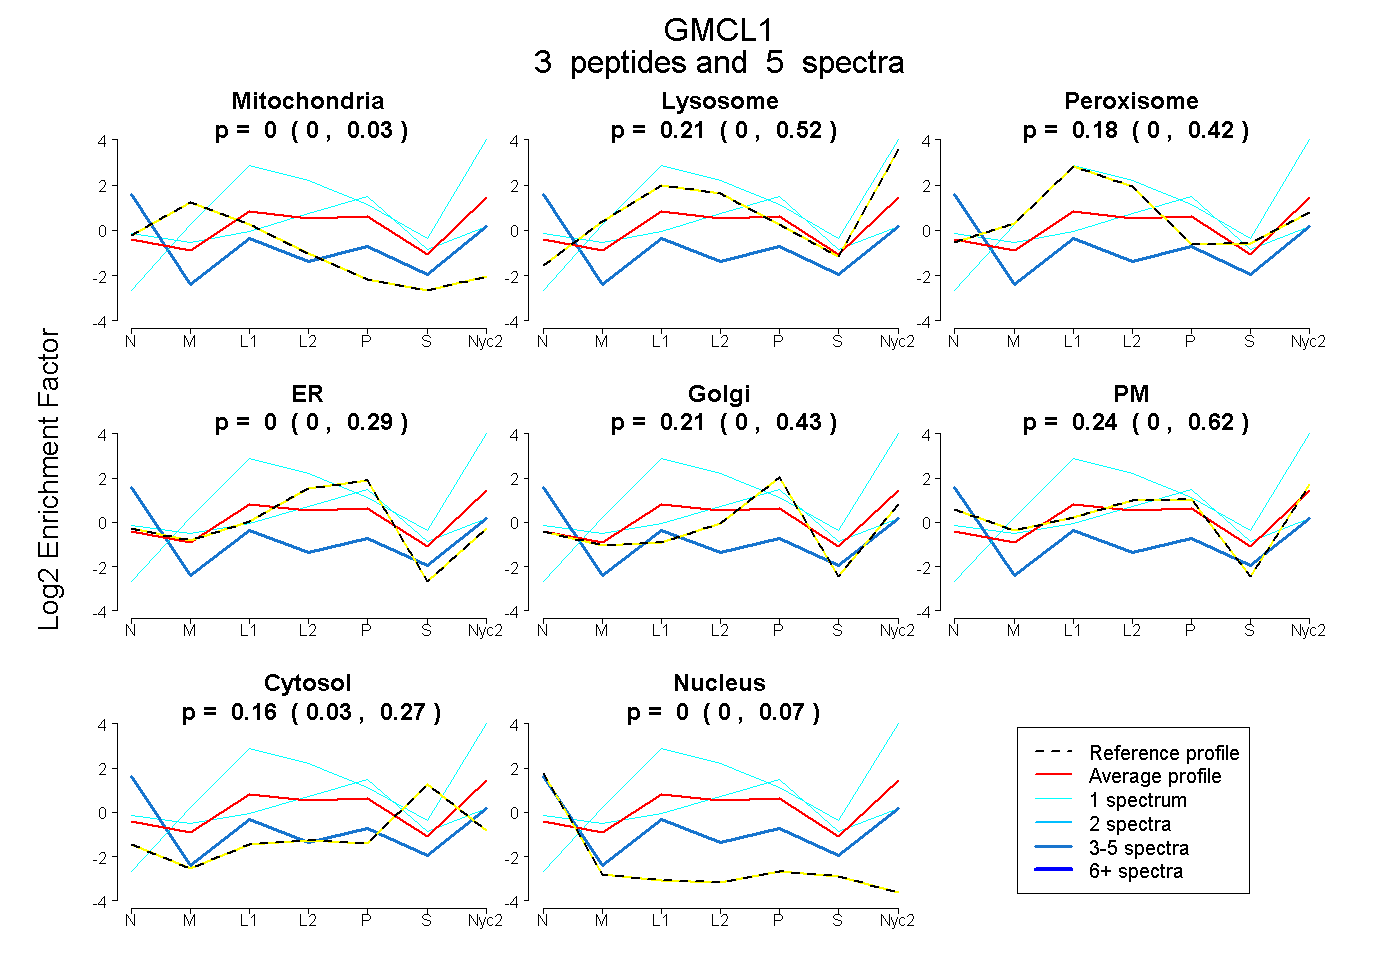
| Plot | Mito | Lyso | Perox | ER | Golgi | PM | Cytosol | Nucleus | |||||
| Expt A |
3 peptides |
5 spectra |
|
0.000 0.000 | 0.034 |
0.208 0.000 | 0.516 |
0.176 0.000 | 0.418 |
0.000 0.000 | 0.292 |
0.213 0.000 | 0.429 |
0.241 0.000 | 0.620 |
0.163 0.025 | 0.266 |
0.000 0.000 | 0.066 |