 3
3peptides
spectra
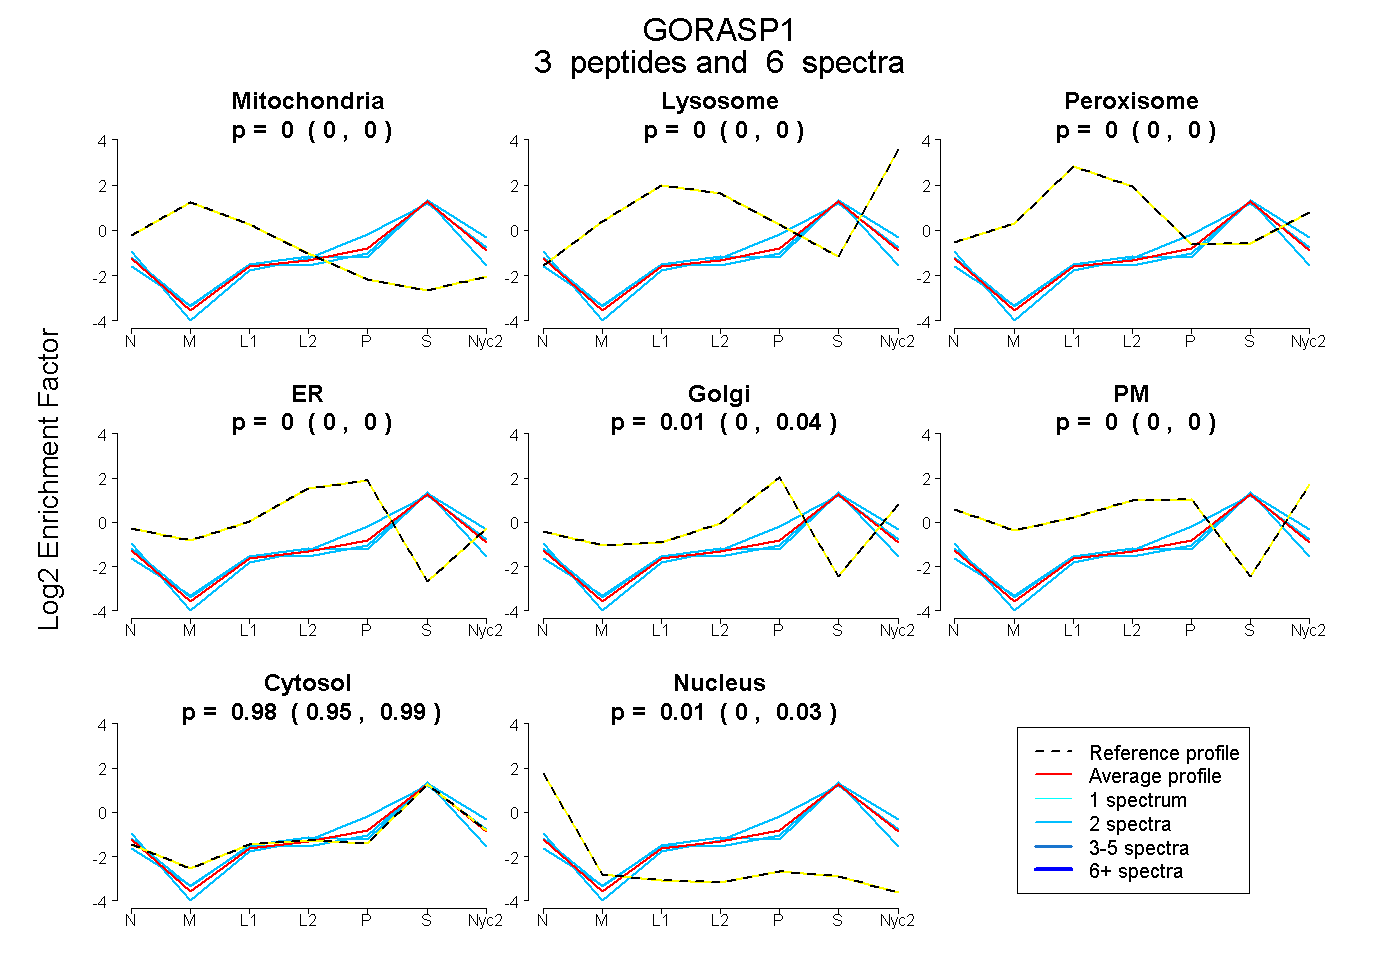
0.000 | 0.000
0.000 | 0.000
0.000 | 0.000
0.000 | 0.000
0.000 | 0.036
0.000 | 0.000
0.953 | 0.994
0.000 | 0.031
| Plot | Mito | Lyso | Perox | ER | Golgi | PM | Cytosol | Nucleus | |||||
| Expt A |
3 peptides |
6 spectra |
|
0.000 0.000 | 0.000 |
0.000 0.000 | 0.000 |
0.000 0.000 | 0.000 |
0.000 0.000 | 0.000 |
0.009 0.000 | 0.036 |
0.000 0.000 | 0.000 |
0.981 0.953 | 0.994 |
0.010 0.000 | 0.031 |
| 2 spectra, LEVFNMK | 0.000 | 0.000 | 0.000 | 0.000 | 0.012 | 0.000 | 0.988 | 0.000 | ||
| 2 spectra, LMVYNSESDSCR | 0.000 | 0.000 | 0.000 | 0.000 | 0.000 | 0.000 | 0.966 | 0.034 | ||
| 2 spectra, IPTQPSSQYK | 0.000 | 0.000 | 0.000 | 0.000 | 0.077 | 0.000 | 0.911 | 0.012 |
| Plot | Lyso | Other | |||||||||||
| Expt C |
1 peptide |
4 spectra |
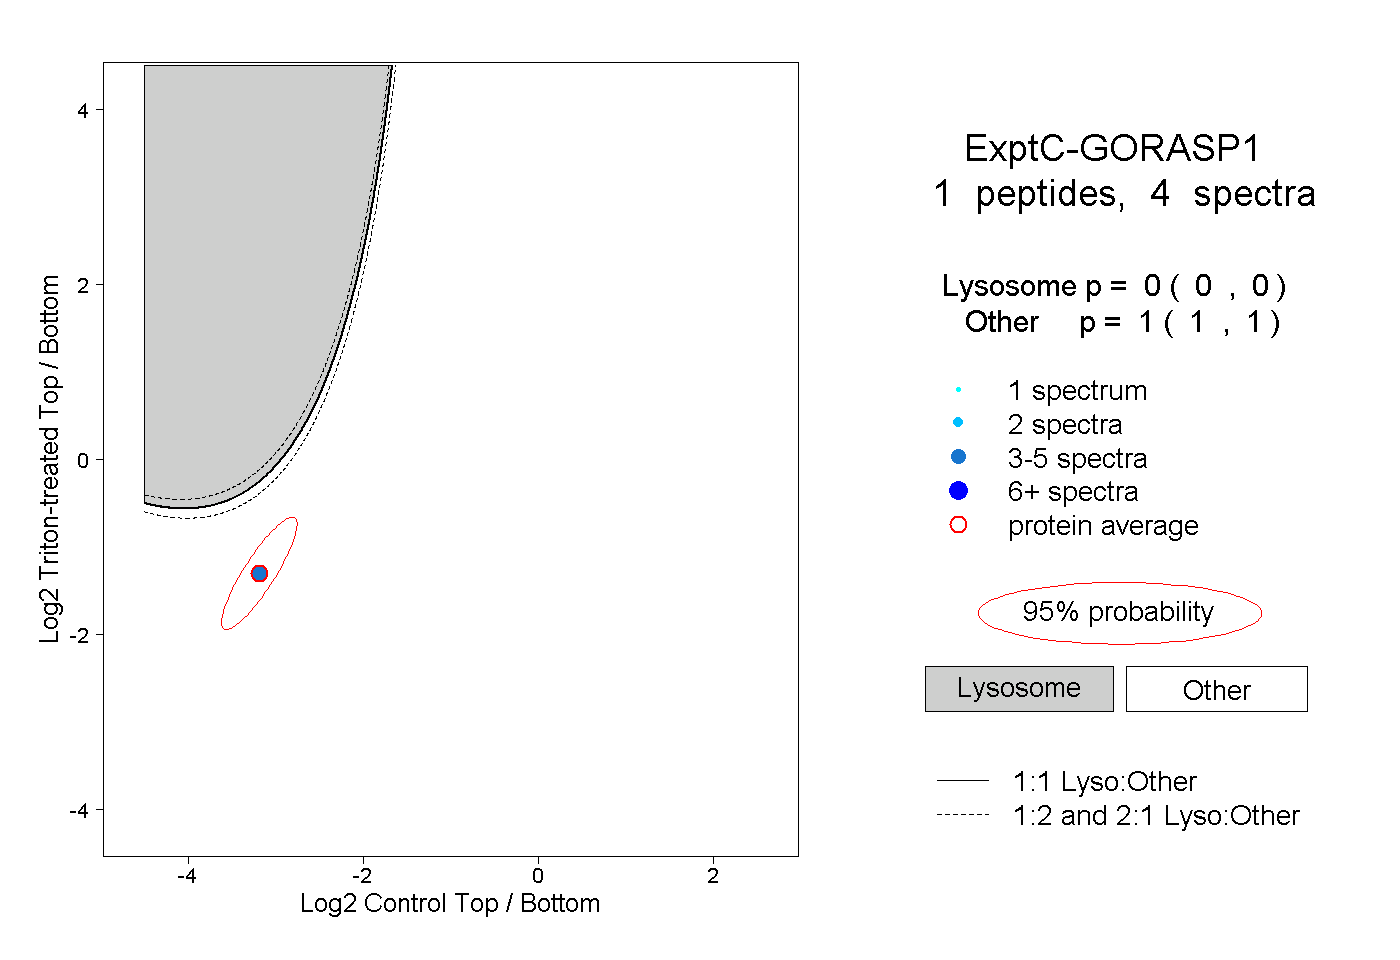 |
0.000 0.000 | 0.000 |
1.000 1.000 | 1.000 |