 2
2peptides
spectra
0.000 | 0.012
0.000 | 0.000
0.000 | 0.014
0.324 | 0.360
0.000 | 0.000
0.000 | 0.000
0.437 | 0.482
0.168 | 0.210
2peptides
spectra
0.000 | 0.000
1.000 | 1.000
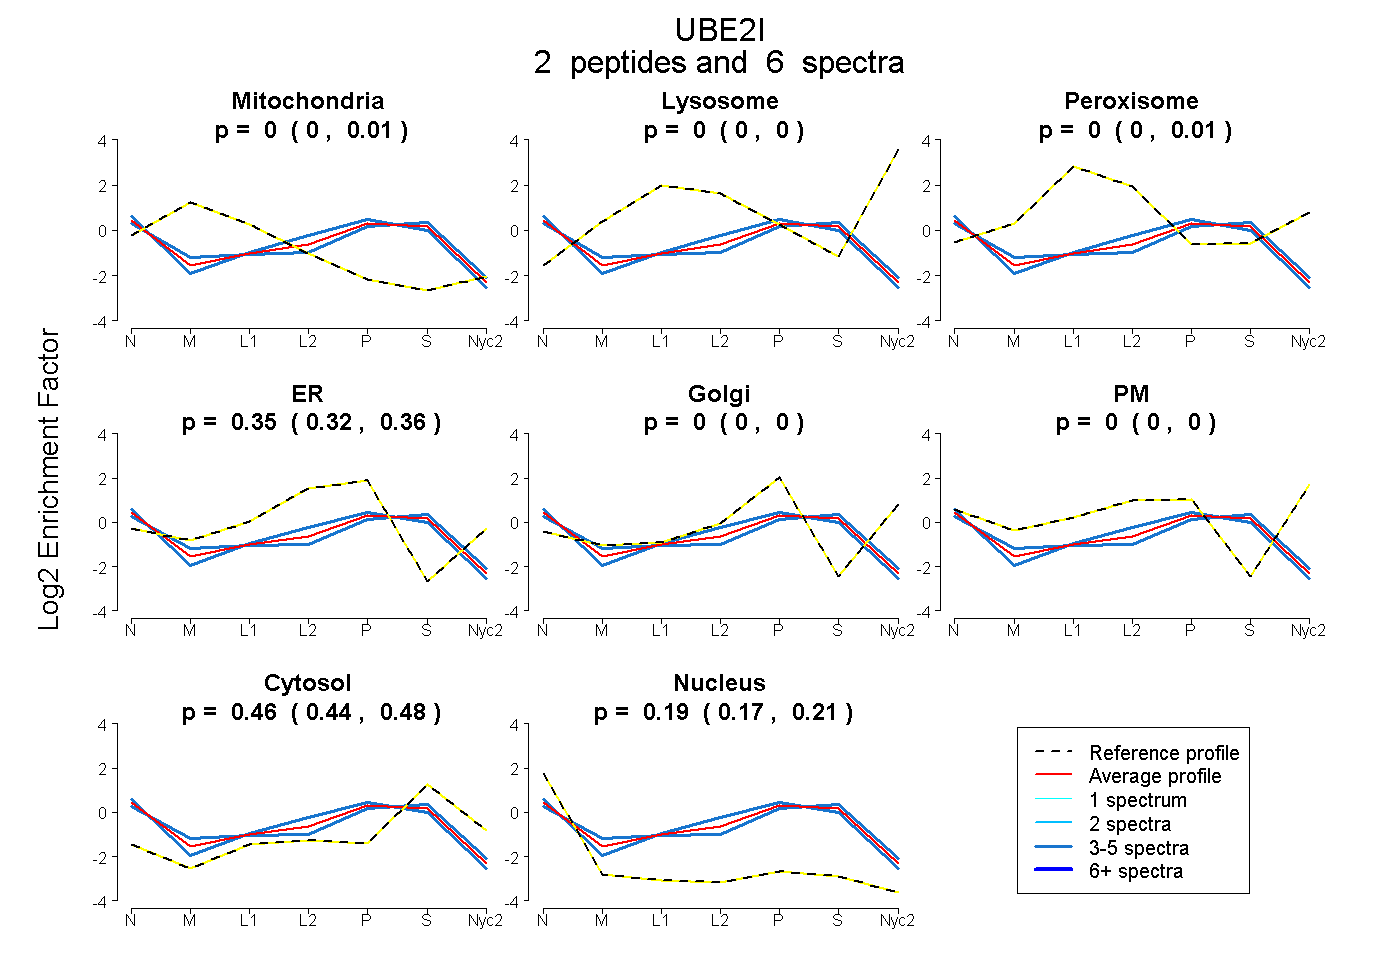
| Plot | Mito | Lyso | Perox | ER | Golgi | PM | Cytosol | Nucleus | |||||
| Expt A |
2 peptides |
6 spectra |
|
0.000 0.000 | 0.012 |
0.000 0.000 | 0.000 |
0.000 0.000 | 0.014 |
0.347 0.324 | 0.360 |
0.000 0.000 | 0.000 |
0.000 0.000 | 0.000 |
0.462 0.437 | 0.482 |
0.191 0.168 | 0.210 |
||
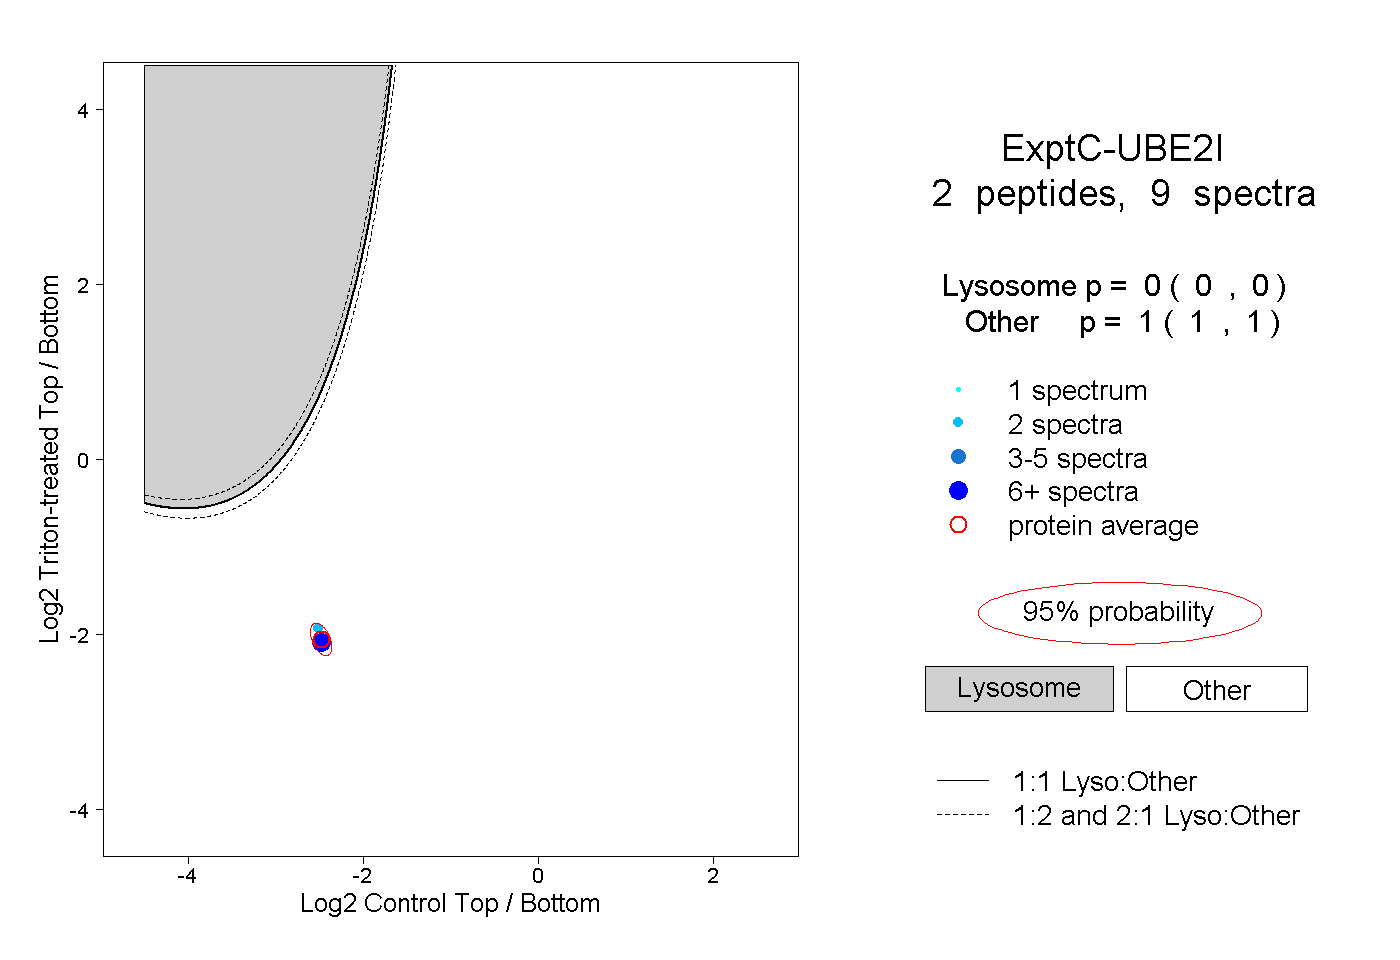
| Plot | Lyso | Other | |||||||||||
| Expt C |
2 peptides |
9 spectra |
|
0.000 0.000 | 0.000 |
1.000 1.000 | 1.000 |