 5
5peptides
spectra
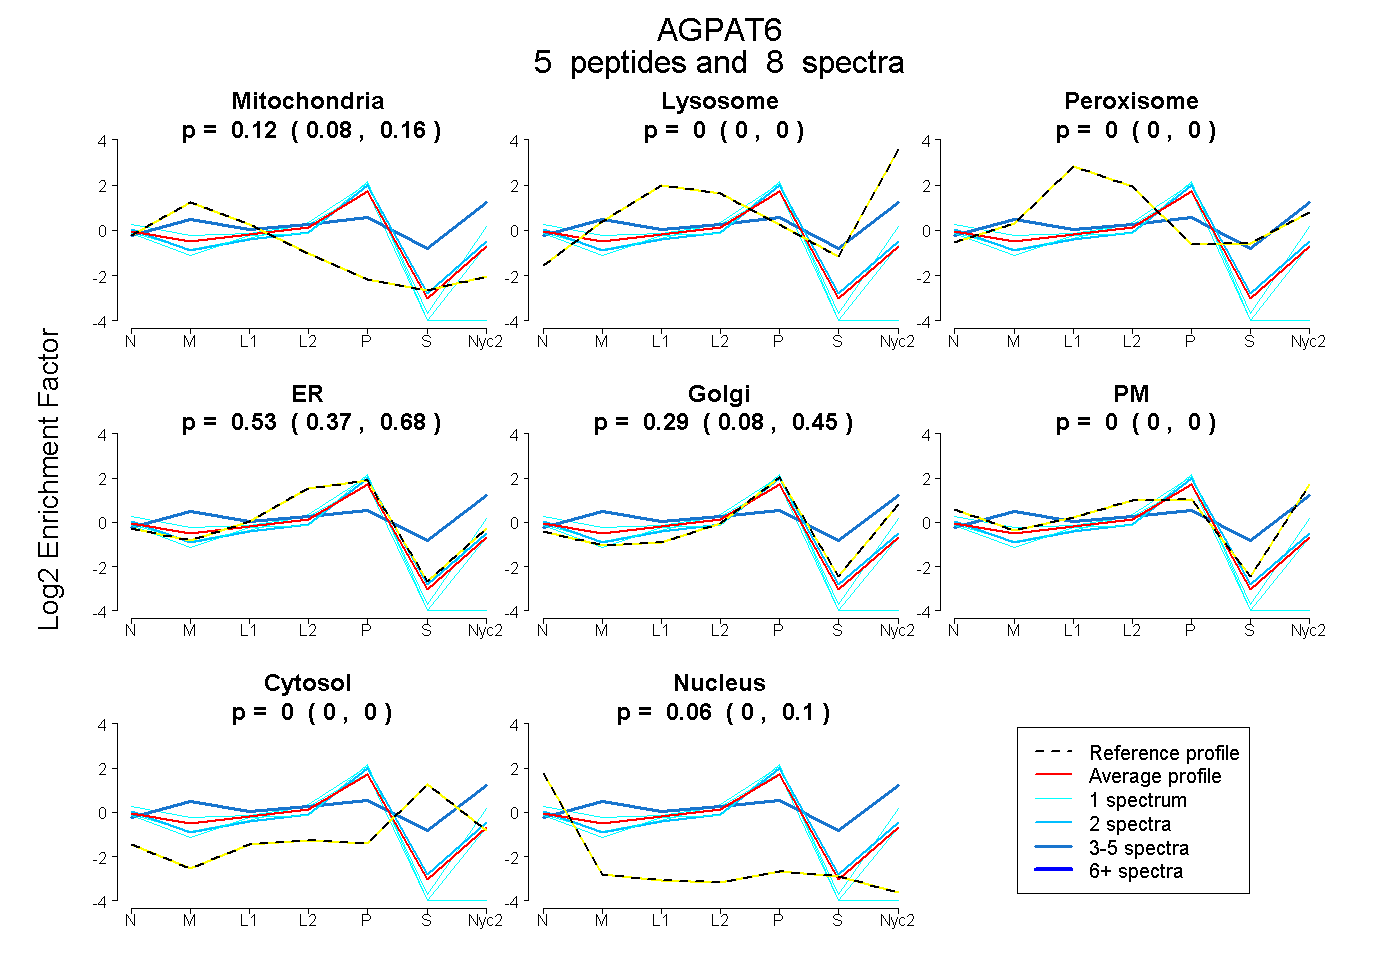
0.076 | 0.160
0.000 | 0.000
0.000 | 0.000
0.366 | 0.681
0.077 | 0.454
0.000 | 0.000
0.000 | 0.000
0.001 | 0.104
1peptide
spectra
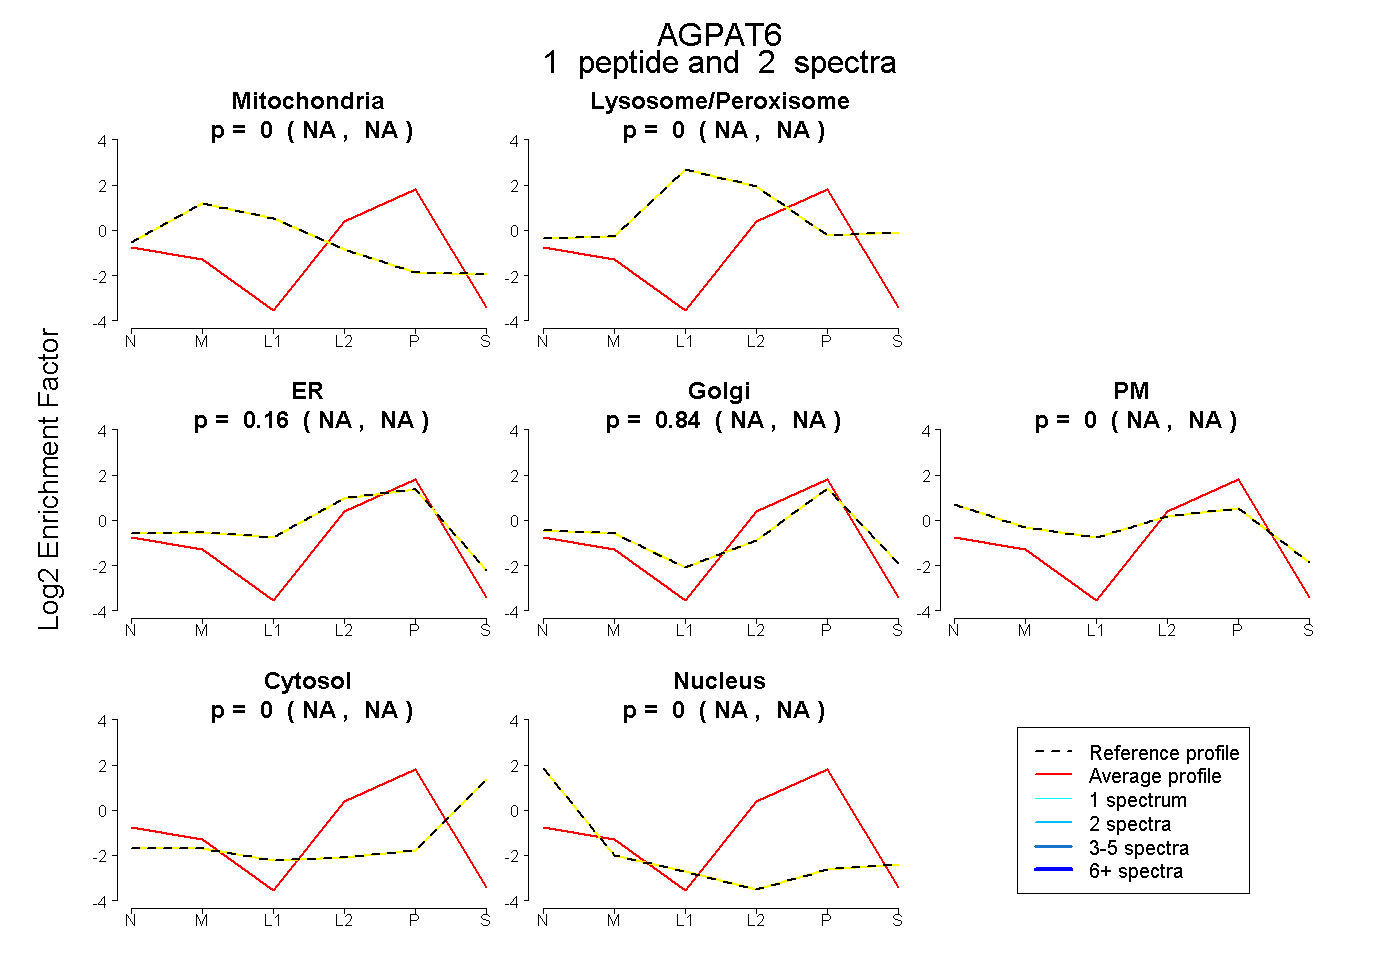
NA | NA
NA | NA
NA | NA
NA | NA
NA | NA
NA | NA
NA | NA
1peptide
spectra
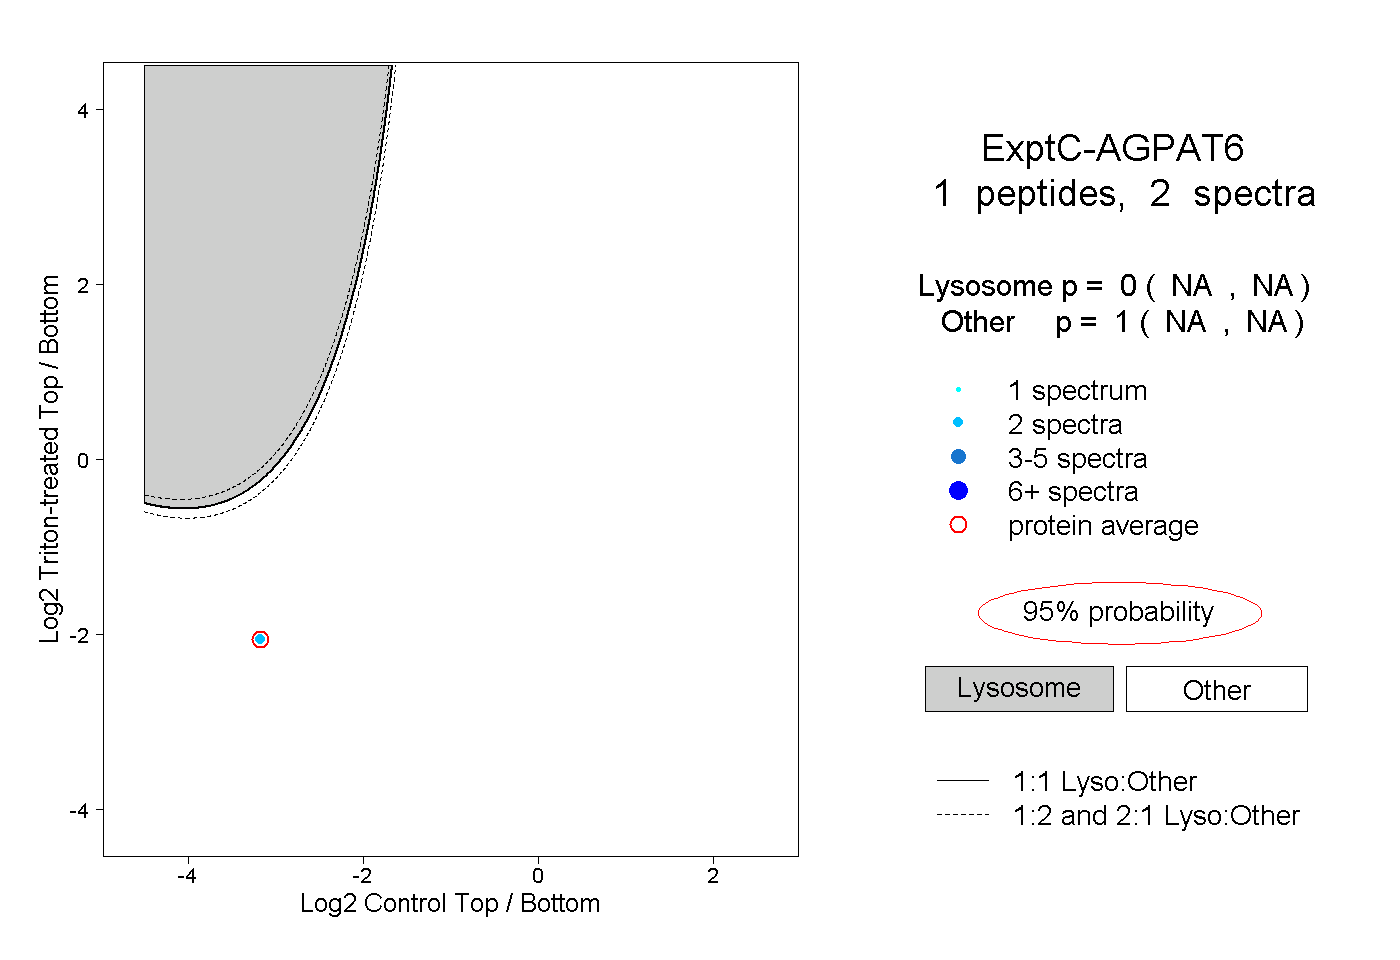
NA | NA
NA | NA