 2
2peptides
spectra
0.000 | 0.021
0.000 | 0.044
0.000 | 0.000
0.000 | 0.000
0.000 | 0.052
0.212 | 0.294
0.664 | 0.712
0.000 | 0.000
2peptides
spectra
0.000 | 0.000
1.000 | 1.000
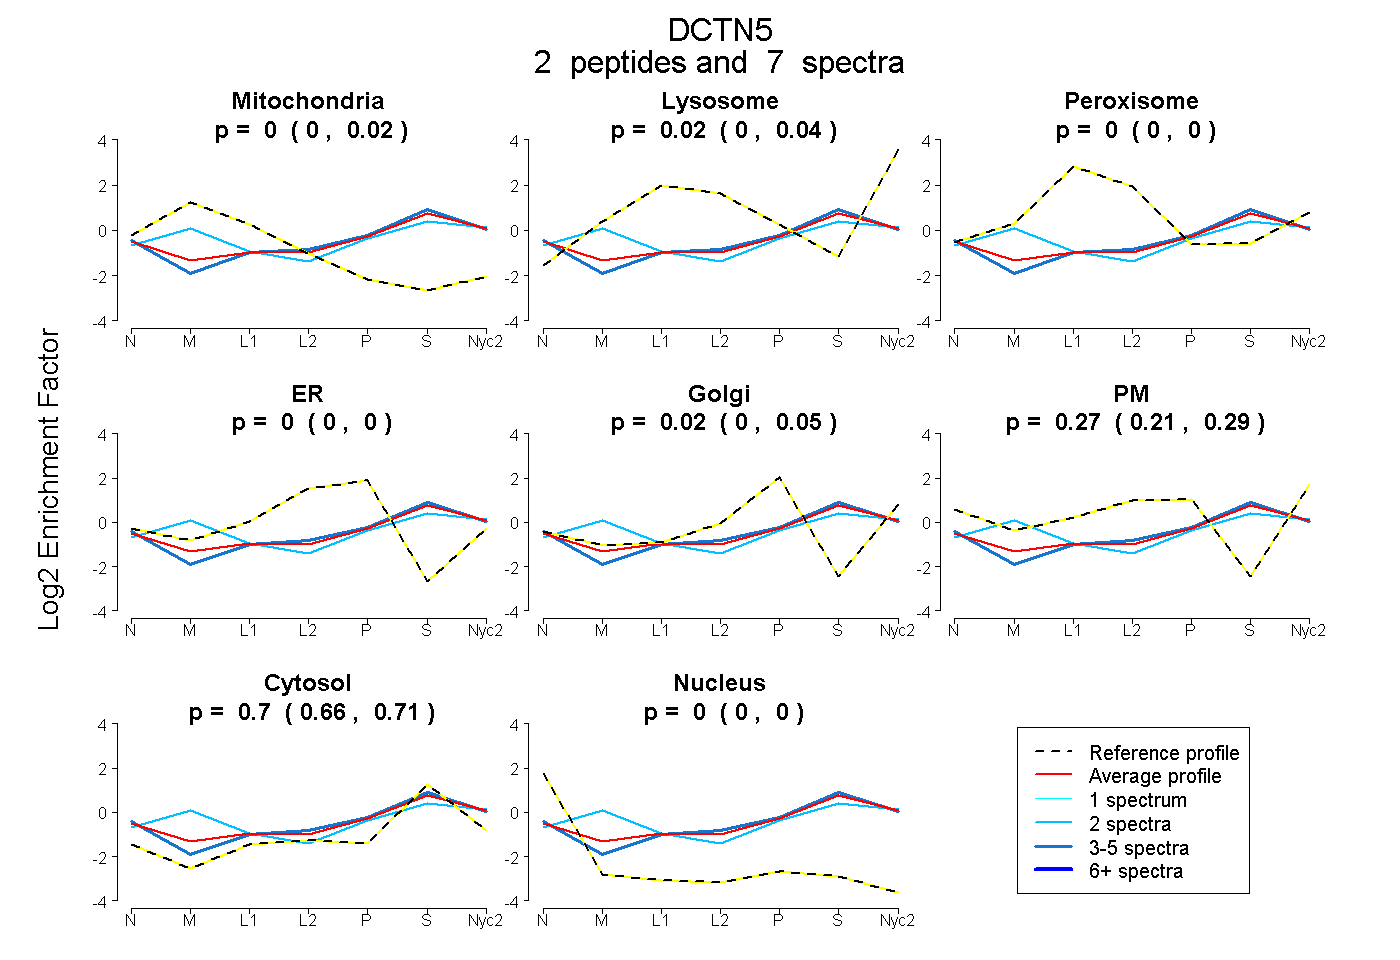
| Plot | Mito | Lyso | Perox | ER | Golgi | PM | Cytosol | Nucleus | |||||
| Expt A |
2 peptides |
7 spectra |
|
0.000 0.000 | 0.021 |
0.018 0.000 | 0.044 |
0.000 0.000 | 0.000 |
0.000 0.000 | 0.000 |
0.017 0.000 | 0.052 |
0.268 0.212 | 0.294 |
0.698 0.664 | 0.712 |
0.000 0.000 | 0.000 |
||
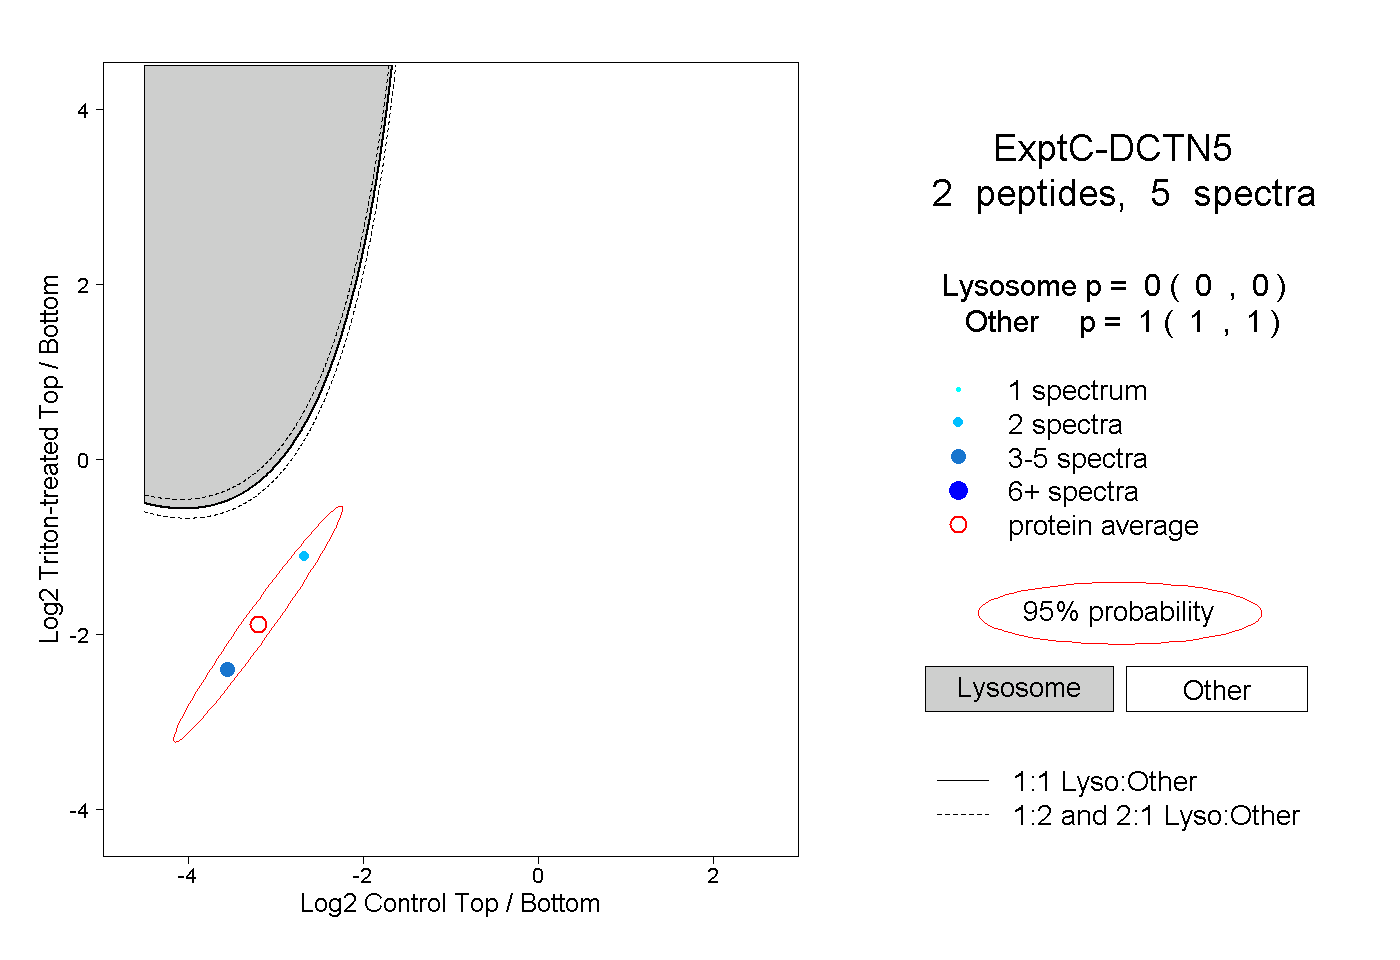
| Plot | Lyso | Other | |||||||||||
| Expt C |
2 peptides |
5 spectra |
|
0.000 0.000 | 0.000 |
1.000 1.000 | 1.000 |