 1
1peptide
spectrum
NA | NA
NA | NA
NA | NA
NA | NA
NA | NA
NA | NA
NA | NA
NA | NA
2peptides
spectra
0.000 | 0.001
0.999 | 1.000
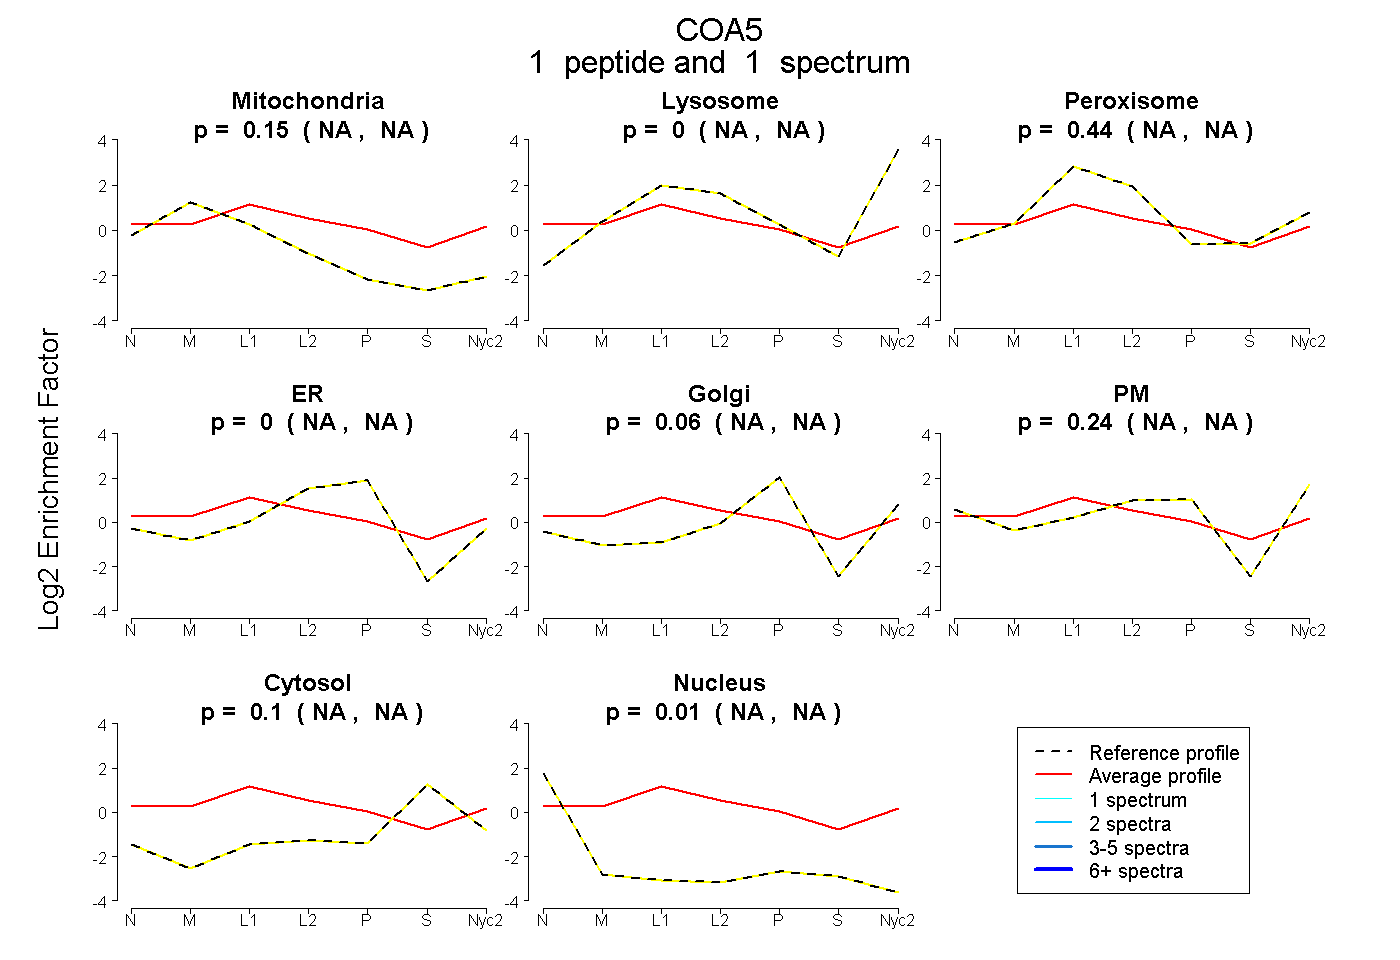
| Plot | Mito | Lyso | Perox | ER | Golgi | PM | Cytosol | Nucleus | |||||
| Expt A |
1 peptide |
1 spectrum |
|
0.146 NA | NA |
0.000 NA | NA |
0.444 NA | NA |
0.000 NA | NA |
0.060 NA | NA |
0.240 NA | NA |
0.095 NA | NA |
0.015 NA | NA |
||
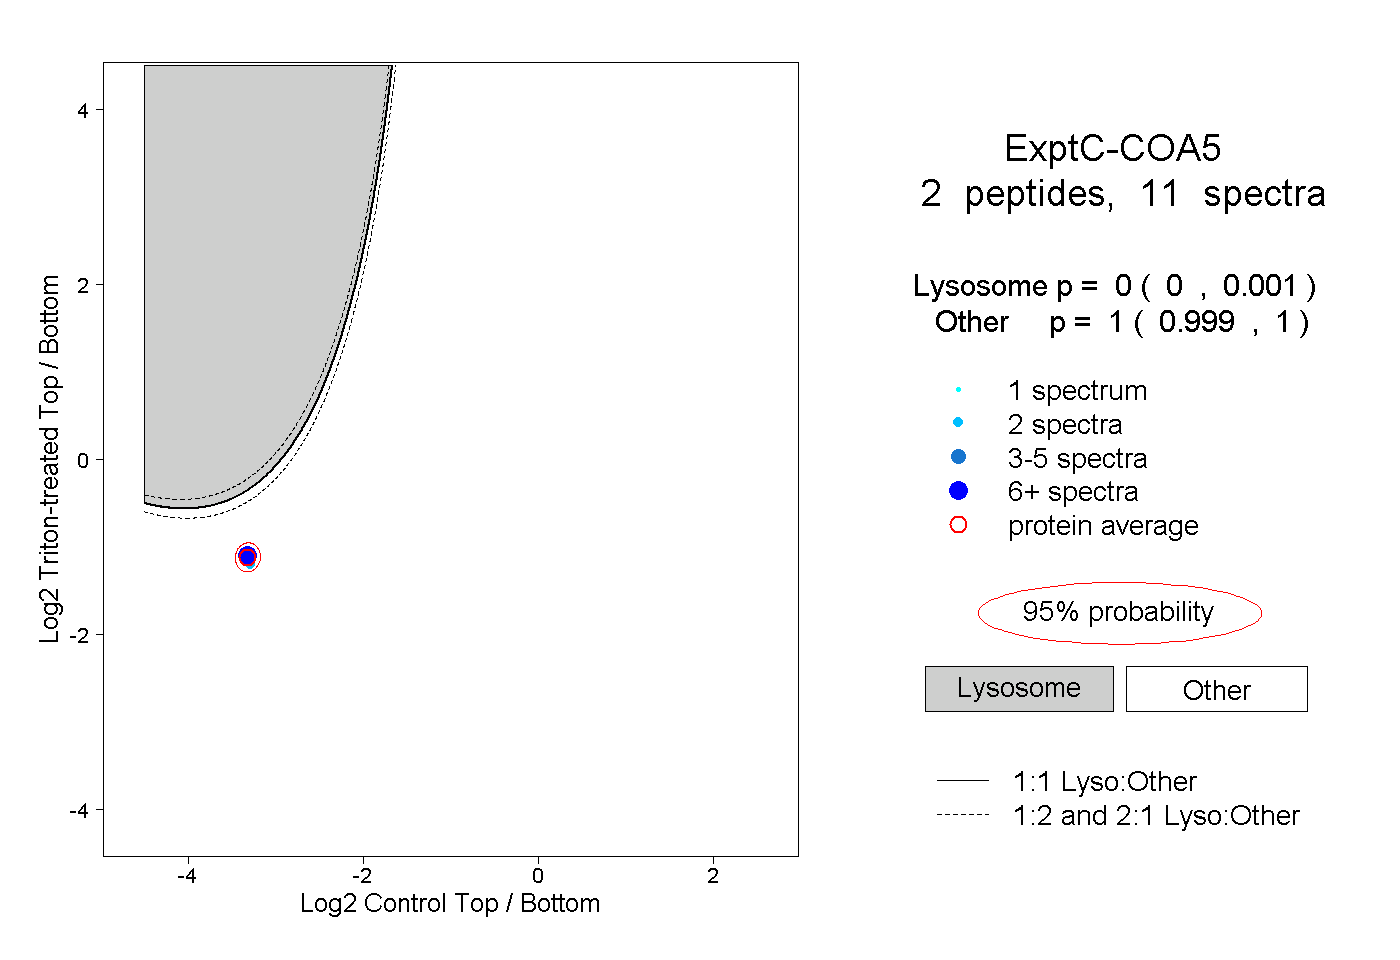
| Plot | Lyso | Other | |||||||||||
| Expt C |
2 peptides |
11 spectra |
|
0.000 0.000 | 0.001 |
1.000 0.999 | 1.000 |